
User Guide
Introduction
Welcome to PetroDE, the world's first petroleum decision engine: an intuitive graphical mapping system for making collaborative, data-driven decisions. PetroDE integrates data from many sources and lets you quickly visualize valuation and activity information for oil and gas assets. It has intuitive search capabilities plus the ability to calculate real-time statistics and display them in presentation ready maps and charts. Proprietary data and saved displays are securely stored in the cloud, making it easily accessible for all team members anywhere, anytime.
1. Getting Started
Before using PetroDE, ensure your computer meets the technical requirements and that you have received a username and password.
1.1 Hardware and Software Requirements
The technical requirements for PetroDE are as follows:
- Web Browser: Current version of Firefox or Google Chrome
- Network Speed: Minimum 1.5 Mbps; Optimal 10 Mbps
1.2 General Navigation
Moving Around on the Map
To zoom in or out, either use the mouse scroll wheel or click on the + and - buttons or slider bar in the top right hand corner of the map. You can also zoom on a touchscreen using two fingers. To pan around the map, click and drag using the left mouse button.
Changing the Basemap Layer
The default basemap layer is Esri World Topography. PetroDE has the following options available for the basemap layer. To select, click the 

Toggling and Sorting Active Layers
Click the Active Layers 

Window Control Options
User interface windows can be moved and resized by clicking on the gray edges. To snap a window to any edge of your screen, move it to the edge and release.
1.3 Logging In and Out
To log in, go to https://petrode.com, click the green Client Login button and enter username and password. To log out, click the logout button  on the bottom toolbar.
2. Search Tools
PetroDE has two Search options, Super Search and Advanced Search. Super search is used to quickly search selected data layers for all the data relating to the input search criteria. Advanced search allows you to further define the query and limit the data results.
2.1 Selecting Data Layers to Search
The first field under the Search tab shows the data layer being searched. To change the search layer, click the down arrow next to it to open the list of workbooks. You can select layers from any workbook. To find a layer quickly, enter the name in the Filter Layers field. Selected layers are listed at the bottom of the Layer Selection Panel. If multiple layers are selected, Multiple Layers will appear in the Layer to be searched field with the number of layers in parenthesis. Layers can easily be toggled off by clicking the red X next to the name. They can also be toggled on and off and sorted using the Active Layers Toolbar 
For a video tutorial on how to select layers and search multiple layers, click here.


2.2 Super Search
To initiate a Super Search, first select one or more data layers to search as described here. and ensure Super is highlighted in blue. Then enter the search criteria in the Search field. Search criteria can be anything associated with the fields in the selected search layer(s). Select the timeframe from the date range selector box. Then click the search button 
For a video tutorial on Super Search, click here.

2.3 Advanced Search
Use Advanced Search to further define a query and limit the data results based on additional criteria.
Please note the following logic is used when different operators are used for the same field: OR logic is used when searching multliple text strings from the same field, while AND logic is used when searching multiple numbers from the same field.
For a video tutorial on how to use Advanced search with an area of interest, click here.

To search for vertical wells in the Niobrara Formation: Select the Advanced Search tab and in the first field, click the drop-down list of fields. They are listed in alphabetical order. Select Formation . Keep starts and ends with (s/e) for the operator. Then enter Niobrara for the Search Term. Now click Add Term and enter Hole Direction from the drop-down list of fields. Then select Contains (con) for the operator and enter V for the Search Term. This will return the following result:
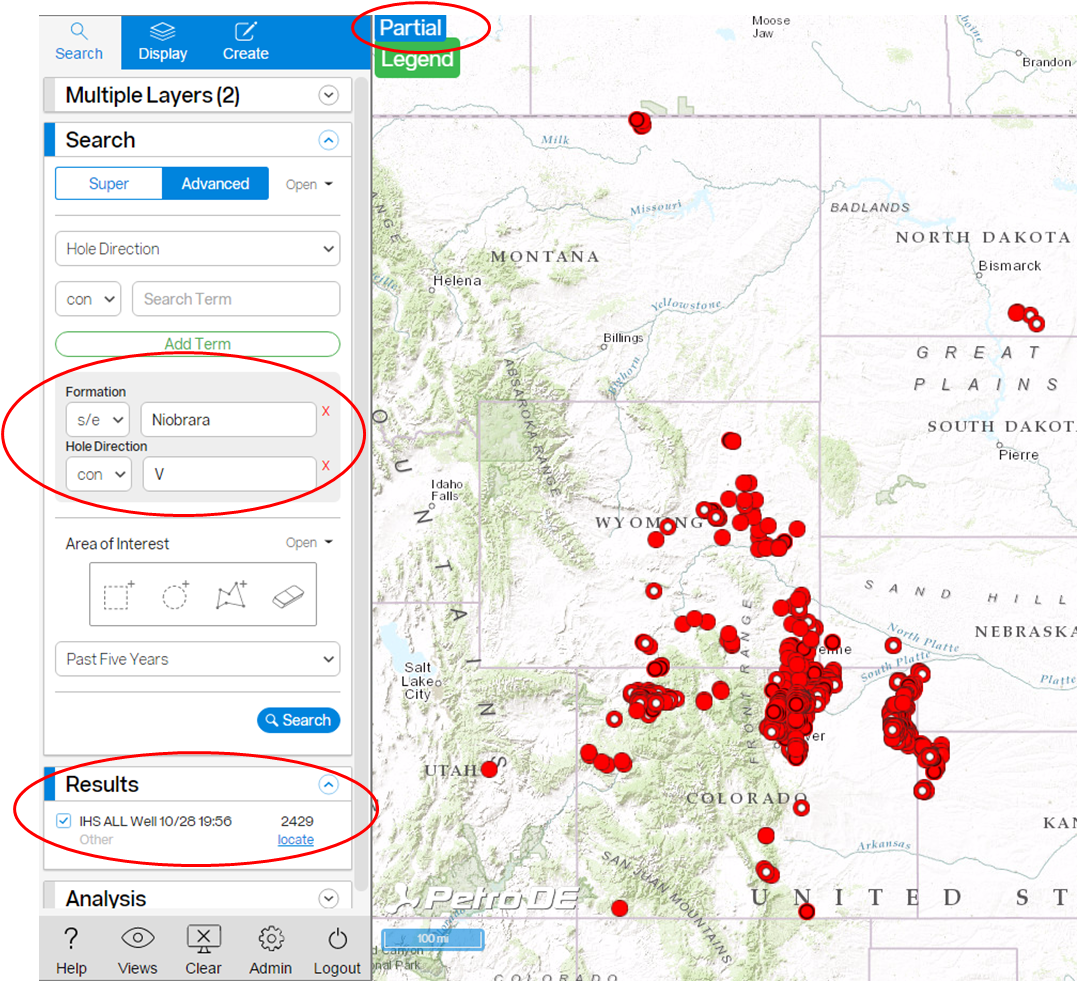
Only one of the selected layers returned a result in the Results panel. IHS ALL Well data returned 2429 wells.
Notice that Partial is shown at the top of the map. This means not all of the search results are being shown on the map because of the density of wells.
A search can be further limited by adding additional search terms.
Advanced Search also has the option to search a unique area of interest, which can be created using the Area of Interest tools.
2.4 Creating an Area of Interest
A search can be further limited by drawing an area of interest on the map. The Area of Interest Tools work the same in either Super Search or Advanced Search.

- Rectangle AOI: select the rectangle tool, and click and drag from one corner to the other.
- Circle AOI: select the circle tool, center mouse over the area desired and click and drag.
- Polygon AOI: select the polygon tool and click once for each point of the polygon, then double click the final point to close the polygon. A polygon can be rotated by clicking on the rotate tool inside the polygon.
- Eraser Tool: to erase an AOI, click the eraser tool, then click on an AOI.
- Save: Click the Save button to save an AOI to the AOI folder. Saved AOIs are retrieved by clicking on Open and selecting from the drop-down list.
2.5 Results Panel
The search results are shown in the Results panel. If more than one layer is being searched, the layer with the most results is displayed by default. The field with the most results is shown first. If more than one field is associated with the search name, they are selectable and listed in descending priority below the primary result. To turn on other data layers, tick the box next to the layer. The order in which layers are displayed can be selected in the Active Layers Toolbar 

The primary field, Formation, returns the most wells with 13,940 for IHS Well Data. RigData was also searched and returns 20 wells in the Niobrara Formation. Clicking on locate will zoom in to the result. Other results for Niobrara are Project Form, IP Production Formation Name, Formation at TD Name, and County. Select any one of these results to view them on the map.
Notice that Partial is shown at the top of the screen. This indicates that the wells are too dense to display all of them on the map. When all wells are displayed, this changes to All.
2.6 Saving a Search Result
A search can be saved in two places. If saved in the Recent Searches folder, they can only be viewed by you. If saved in a Workbook, they can be seen by anyone with access to the Workbook. A view including an Analysis such as a heat map and/or Refined results may only be saved to a workbook or folder using the Views icon.
For a video tutorial on how to save a search or view, click here.
Saving a Search Result in the Recent Searches Folder
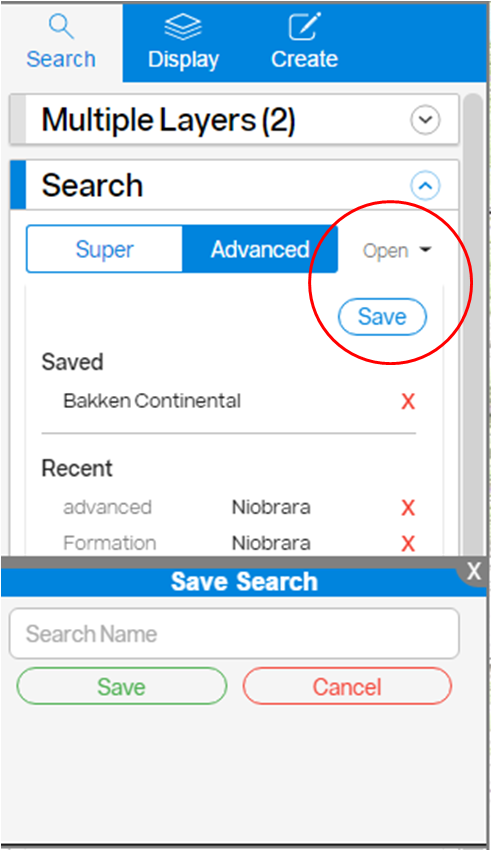
To save a search result to your recent searches folder, click the Open drop-down arrow in the Search Panel and select Save. This will save to your Saved folder and can only be viewed by you.
Saving a View in a Workbook
To save a view in a Workbook, click the Views


2.7 Opening Saved and Recent Searches
To retrieve a recent search result, go to the Search tab and click the drop-down menu next to Open. The last ten searches are listed under Recent and Saved Searches are listed under Saved. Anything saved to this folder can only be viewed by you.
To open a Saved View available to a Team, go to the desired Folder under the Display tab. If the folder is unknown, use the Filter Layers field to find it. Recently saved views can also be found by clicking the Views 
NOTE! Views saved with dates from the date range selection menu before changes were made in release 2018006 will have the dates listed under Default Date. It is advisable to update the view to search on the named date column instead of on defualt date to avoid confusion when sharing the view.i>
To open a custom Heat Map or Chart, select it from the Saved option in the Heat Maps or Charts selection panel.
NOTE! Views are automatically updated to meet the query, i.e., any data that has been added or updated since the view was saved will be included at the time it is next viewed.
2.8 Sharing a Map View Link
Share any saved map view with other licensed users by sending a URL link. Get the link by either selecting the view in the Display tab and selecting Get View Link from the drop-down menu or go to Views in the bottom toolbar and select the share link icon next to the desired view.
2.9 Downloading a Map View
To download the current map view, click the download button in the top right corner of the map. The following options are available:
- PowerPoint
- Current Screen
- 1920 x 1080
- 1024 x 768
- 800 x 600
- 640 x 480
2.10 Downloading a Search
To download the current search, click Download Search in the Analysis card. The following options are available:
- Shapefile: Limit is 200,000 rows
- CSV: Limit is 200,000 rows
2.11 Pop-up Balloons for Overlapping Features
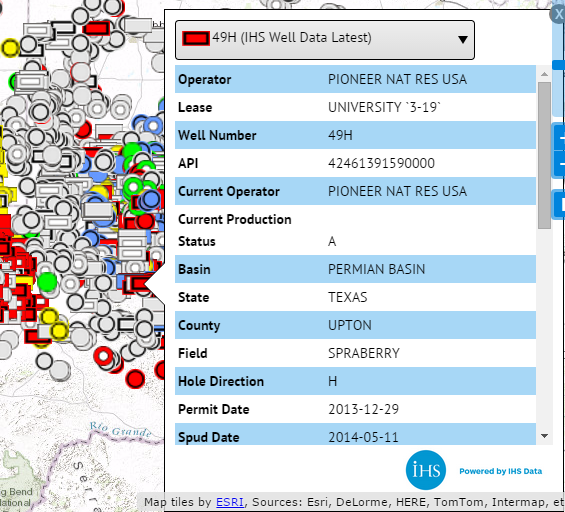
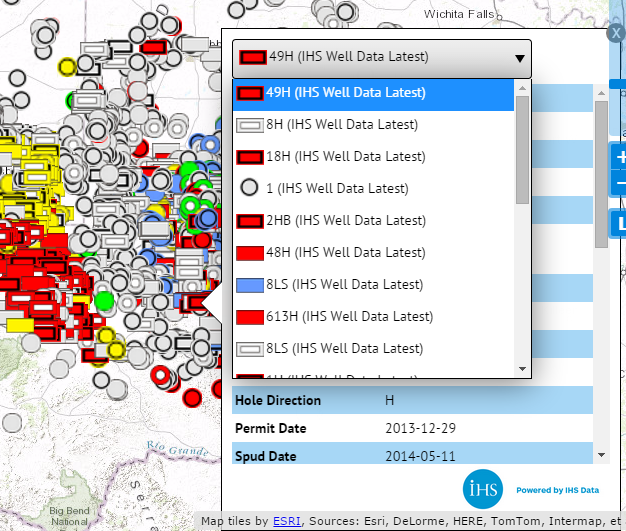
In areas with a high density of data, features overlap at certain zoom levels. In such areas, the pop-up balloon has a drop-down list showing the overlapping features. Click on the drop-down list to see the overlapping features. The layer searched for each feature is shown in parentheses. The feature style icon will also change if more than one layer is included on the map. Clicking on a feature will bring up its unique pop-up balloon. The figure below is an example from the Permian Basin, which has a high density of wells.
3. Analysis Tools
The Analysis Panel located at the bottom of the Search tab allows you to analyze a search result by detecting changes since the last data update, further refining your search, displaying the result using different symbology, or using charts and histograms to visualize the data.
The data layer listed under ANALYSIS is used in the calculations. To change the layer for analysis, click on the drop-down next to the layer name and select from the available active layers.

The following options are available in the Analysis panel:
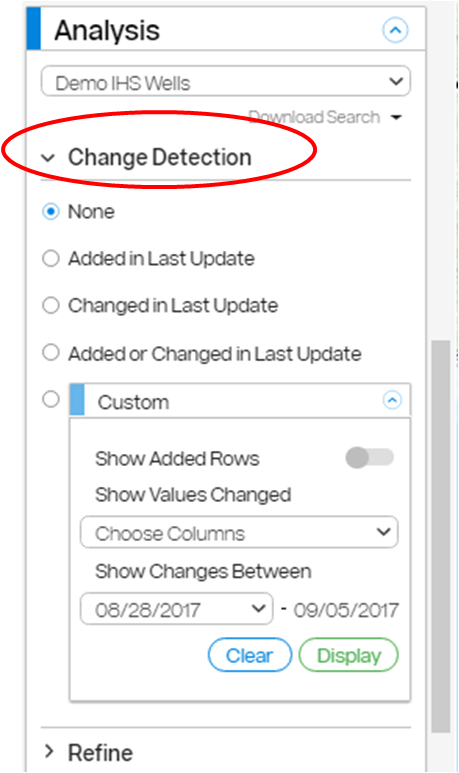
- Change Detection - Show changes to data either added or changed or both since the last data update
- Refine- Further refine your search result by available columns for the data layer
- Map Display- Choose how to display the map symbology:
- Symbols - Choose to view by Formation, Productivity, Operator, Common Well Symbols, Color By, or by a user defined style.
- Directionals - Add Well Sticks to the map view.
- Labels - Add labels to the map view.
- Heat Maps - Display the selected layer with heat map symbology based on a certain parameter.
- Bubble Maps - Display the selected layer with graduated symbols to show parameters of interest in ascending or descending order.
- Charts- The following charts are available
- Bar Charts
- Cross Plots
- Histograms
- Time Series
3.1 Detecting Changes Since the Last Update
To view changes and/or additions since the last data update for the layer being searched, change detection must be enabled for that layer. Contact support at Support@PetroDE.com to request change detection.
View changes as follows:
- Open the Change Detection card, which is found in the Analysis panel. Choose from the available options:
- Use the custom option to see changes for a particular column and/or date.
- Click on Choose Columns to choose one, multiple, or all columns that you want to search. Click the date drop-down to select the desired date range.
- To see what changed, click on any text balloon and select the Changes button. All fields with changes are listed with the previous value and current value.


3.2 Watchlist Notifications
There are three options available to track changes and stay informed of changes:
- Pick wells from within PetroDE maps and add them to your Notifications Watchlist.
- Load a list of unique IDs from your data layer into your Notifications Watchlist.
- Create a Scout View
Pick Wells from the PetroDE map
- Display your data layer in PetroDE. Note that the Watchlist Notification feature is only available on layers with change detection enabled. The layer displayed here is IHSM Wells.
- Select a well that you are tracking. In the text balloon, check the Notify Me box in the top left corner. Repeat this step for all the wells on your watchlist.
- Now you have a Notifications Watchlist. To view and/or edit your notifications watchlist, go to the Display Tab and click the drop-down menu next to the layer you are working with. Select Edit Notifications.
- Your Notifications list is displayed. It is possible to delete items from this list by clicking the red X next to the item. To add items to your list, select the Edit button. Click the Save button to save your list. To confirm your e-mail address where weekly updates will be sent, click OK.


Load a list into your Notifications Watchlist
- To load your own list of wells from a unique identifier column (e.g., APIs) into your Notifications Watchlist, go to the Display tab and click the drop-down menu next to your data layer of interest. Select Edit Notifications. Then select the Edit button.
- Copy and paste a comma delimited list from the column in your layer that contains the unique identifier. In this example, we are loading a list of APIs. Click the List button and check that your list is accurate. Items can be deleted by clicking the red X next to the item. To add more items to your list, click the Edit button and add the item to your list.
- When your list is complete, click the Save button followed by the OK button to confirm your e-mail address where weekly updates will be sent.


Create a Scout View
In the following example, we search the IHSM Wells layer. Note that when setting the conditions for your Scout View, you can use Advanced Search and/or Refine to select the columns and criteria that are of interest to you. For example, Refine on Company and select one or more companies of interest, select IP GOR and enter a minimum IP value, select a formation, etc. The possibilities are nearly endless.
- Draw an area of interest using the AOI tools.
- From the Display tab, turn on any reference layers that may be useful for your view. We added WhiteStar Grid.
- Select Refine and enter the column of interest. We chose IP Boe6(/ft). Drag the value bar of the results to select the desired range of values or input a specific numeric range into the boxes. Next, we chose to refine by Formation = Wolfcamp.
- Once you have defined the area and criteria that you are interested in tracking, select Notifications -> Scout Views. Then select the Create Scout View button.
- In the Save Scout View Window that appears at the bottom of the UI, enter the Destination folder where you want this view to be saved and the name of your view. Click the Save button.
- A window will pop up to verify your email address. Click OK. This will trigger a weekly email notification to be sent to you with a link to your updated view. Simply click on the Open in PetroDE link to go directly to your Scout View. Easy!
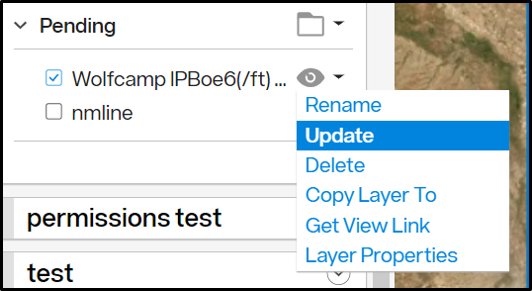
- To edit a saved Scout View, go to the Display tab and find your Scout View in the folder you specified, or use the filter box to find it. Click the drop-down menu and select Update.
- Note that Scout Views have a dark gray eyeball icon and standard views have a clear eyeball icon.



3.3 Refining Search Results by Column
To further refine a search result, open the Refine Tool, which is found under the Analysis panel. Click the drop-down menu to select from the available fields. Several data attributes can be viewed at one time and can be clicked and dragged to rearrange the order of importance.

Data Attributes with number values have a slider bar to allow for easy refinement by any number available. Note that null values can be included by ticking include null values. An example showing Completion date is shown below. Dates can be further refines by clicking on a bar, sliding the slider bar, or entering exact dates in the fields below the slider bar. The map is updated automatically as selections are changed.
For a video tutorial on how to Refine a Search, click here.

3.4 Selecting Display Symbols
Wells are initially shown with the default symbology assigned to the layer. Data layers have the option to be displayed with symbols based on multiple columns, discussed here. The display symbols can be changed by selecting Map Display -> Symbols in the Analysis panel of the Search Tab.
For a video tutorial on Display Symbols, click here.
Symbology for IHS Data
IHS data can be displayed by:
- Formation
- Productivity
- Operator
- Common Well Symbols
- Color By (any column)
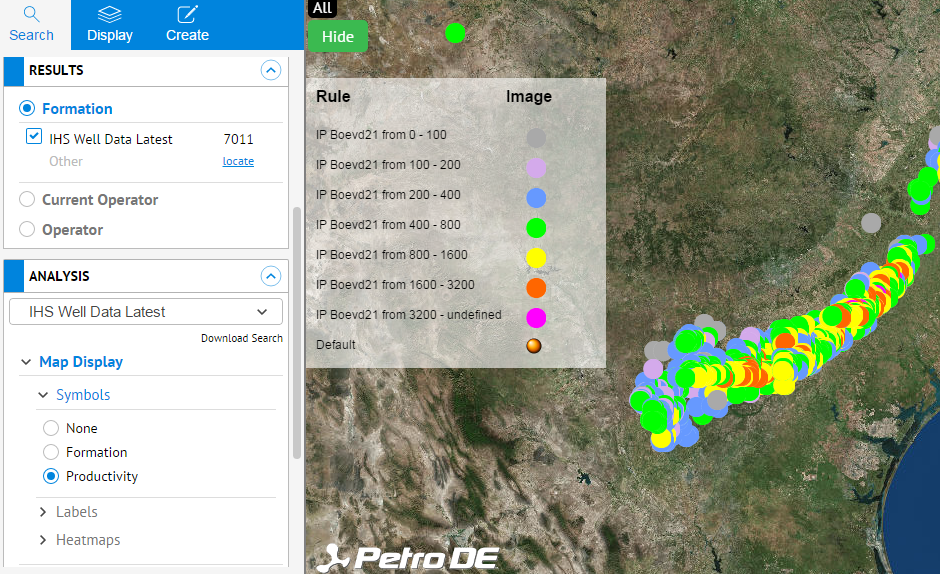
Formation maps are the default map type and are color coded according to formation. A list of the formation color codes is listed here. The legend defines the well activity symbols. Click legend again to hide it.

Productivity maps show wells color coded by productivity and have the following color code:
Operator maps show wells color coded by Operator as follows:

Well data can be displayed with common well symbols as follows:


Color By Column
Any data layer can be displayed by color for a chosen column by selecting Map Display -> Symbols -> Color By. These colors can coordinate with the colors in the bar charts if the same column is used for both the display and the x-axis of the chart. For example, a layer colored by Operator with a bar chart for IP Operator, will show the chart in the same colors as the map display.

User Defined Style Groups
Data layers have an option to be displayed with symbols based on multiple style groups for selected columns. Styles are created in the Create Layer wizard when either creating a new layer or editing the styles for an existing layer. The default layer style group is selectable in the Create Layer wizard. For example, a layer may have the option to display symbols for either the Formation, Current Operator, or Well Status as shown for the PowderRiverData layer below.

3.5 Displaying Well Sticks
Well sticks can be displayed on IHS Well Data. Under Map Display -> Symbols, simply click on the Symbol type, e.g., Formation, Production, etc. then go to Directionals and select Well Stick. There is also a toggle that enables users to display symbols at the Surface or at the Bottom Hole Location (BHL) as illustrated below.

3.6 Displaying Labels
To add labels, go to the Analysis panel of the Search tab and click on Labels. Features can be labeled by your choice of available fields from the searched data. Open the drop down to choose columns that you wish to be labeled next to the data point. The labels will display in the order in which they are selected. In this example, the wells are labeled by Completion Date, Final Status, Operator, and IP Boevd21.

3.7 Displaying Heat Maps
To see the search result displayed as a heat map, go to the Analysis panel of the Search tab and click on Map Display and then Heat Maps.
The options include prepopulated heat maps as well as saved and custom heat maps as follows:
- IP
- Other - includes Horizontal Well Count, Top Formation, Top Operator, Vertical Well Count, and Well Count
- Treatment
- Peak 30
- Peak 60
- Peak 90
- Saved
- Custom
Grid Selection
The heat map grid selection menu includes 1-Mile, 3-Mile, 6-Mile, and Counties, followed by an alphabetized list of all of the polygon layers a user has access to. For example, if you had a leasehold layer or a basins layer, you can use those layers to grid a heat map.

The screenshot below shows a past year BOEVD21 heat map of IHS wells with West Texas Leases as the grid.

3.8 Custom Heat Maps
To create a custom heat map, go to the Analysis Panel and select Map Display -> Heat Maps -> Custom. First choose the grid size. Then choose the Column from those available in the drop-down list.
If viewing Number or Date data, choose how to aggregate the data from the Summarize By drop-down menu.

Next, choose the color scale by clicking on the color bar drop-down menu and selcting one of the presets.
To further customize the heat map, open Edit Legend. For string values, you can change between automatic and custom. In the heat map of Operators below, we selected Custom and changed the legend colors for Anadarko and Kerr-McGee to be blue by clicking on the color square. We then moved Kerr-McGee to be next to Anadarko in the list by clicking and dragging. We also added and Burlington and Conoco to the list by clicking the + button and typing in the Operator Names next to the added color squares. We set their color to cyan.
NOTE: Even though Anadarko and Kerr-McGee are the same color in the legend, it doesn't mean that they are counted as one entity - they are still separate entities in terms of aggregating values.

For number and date values, users can change between log and linear as well as percentiles and values. For example, in the IP Boe6 example below, we selected to display by value and changed the default heat map values shown in the figure on the left to the values shown in the figure on the right. Values are changed by simply clicking on the value and typing a new value in its place.


Saving Custom Heat Map Templates
To Save a Custom Heat Map either as a template or to view later, Click the Save button. Type in a name followed by the enter key. It will be available to view later in the Saved option under Heat Maps. The saved "template" can be used with other search criteria if desired.
To download the CSV or shapefile for a Heat Map to your desktop, select Download Heat Map just below the Save button in the Custom Heat Map panel.
3.9 Displaying Bubble Maps
To view the search result as a bubble map with graduated symbols in either ascending or descending order, go to the Analysis panel of the Search tab and click on Map Display and then Bubble Maps. Bubble maps can display data from one or two columns as described in the following sections.
For a video tutorial on how to view bubble maps, click here.
Single-Column Bubble Maps
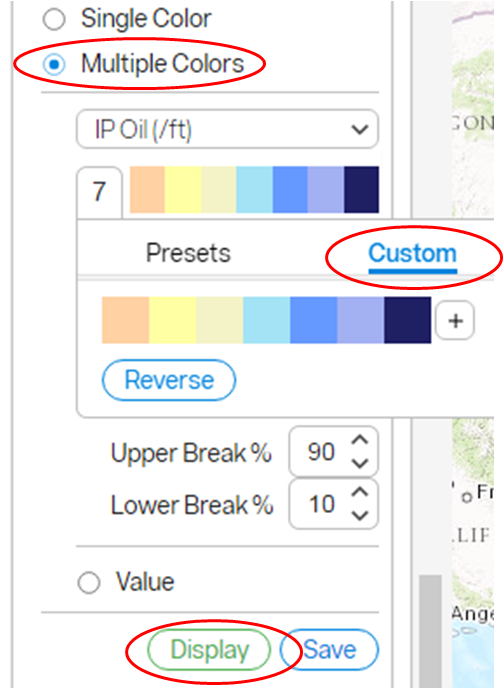
To display data from one column in a bubble map, click on Custom and select the Size by column you wish to view. Select either Ascending or Descending where ascending shows the largest bubble with the largest value and descending shows the largest bubble with the smallest value. Values are proportional to the radius of the bubble. To display labels, tick the Show Value as Label. Next, select to display the data as a Single Color or as Multiple Colors and choose colors. If Multiple Colors is selected, select the same column as that selected in the Size by column. Choose your color bar by clicking on the color bar drop-down menu and selecting one of the five presets. To further customize the color bar, click on Custom. Add colors by selecting the + symbol and remove colors by clicking and sliding them off the panel. Click on any color block to change it. Choose to display as log or linear scale and set the upper and lower bounds. Bounds may be displayed as either percentiles or values. Click the Display button to view the resulting map.

Two-Column Bubble Maps
To display data from two columns in a bubble map, click on Custom and select the Size by column. Select either Ascending or Descending where ascending shows the largest bubble with the largest value and descending shows the largest bubble with the smallest value. Values are proportional to the radius of the bubble. To display labels, tick the Show Value as Label. Next, select to display the data as Multiple Colors. Select the second column you wish to display. Choose your color bar by clicking on the color bar drop-down menu and selecting one of the five presets. To further customize the color bar, click on Custom. Add colors by selecting the + symbol and remove colors by clicking and sliding them off the panel. Click on any color block to change it. Choose to display as log or linear scale and set the upper and lower bounds. Bounds may be displayed as either percentiles or values. Click the Display button to view the resulting map.


The following example shows a bubble map sized by IP Oil (/ft) and colored by IP Water. It is displayed in log scale and bounded with an upper break of 90% and a lower break of 10%. The largest orange bubbles show where there is more oil and less water. The smallest dark blue bubbles show where there is less oil and more water.

3.10 Chart Features
A search result can be analyzed with charts and histograms. The chart and histogram tools are found in the ANALYSIS panel of the Search tab. The data layer being used in the calculations appears at the top left of the chart window.
Chart features are illustrated in the two figues below.


Chart Subsearches
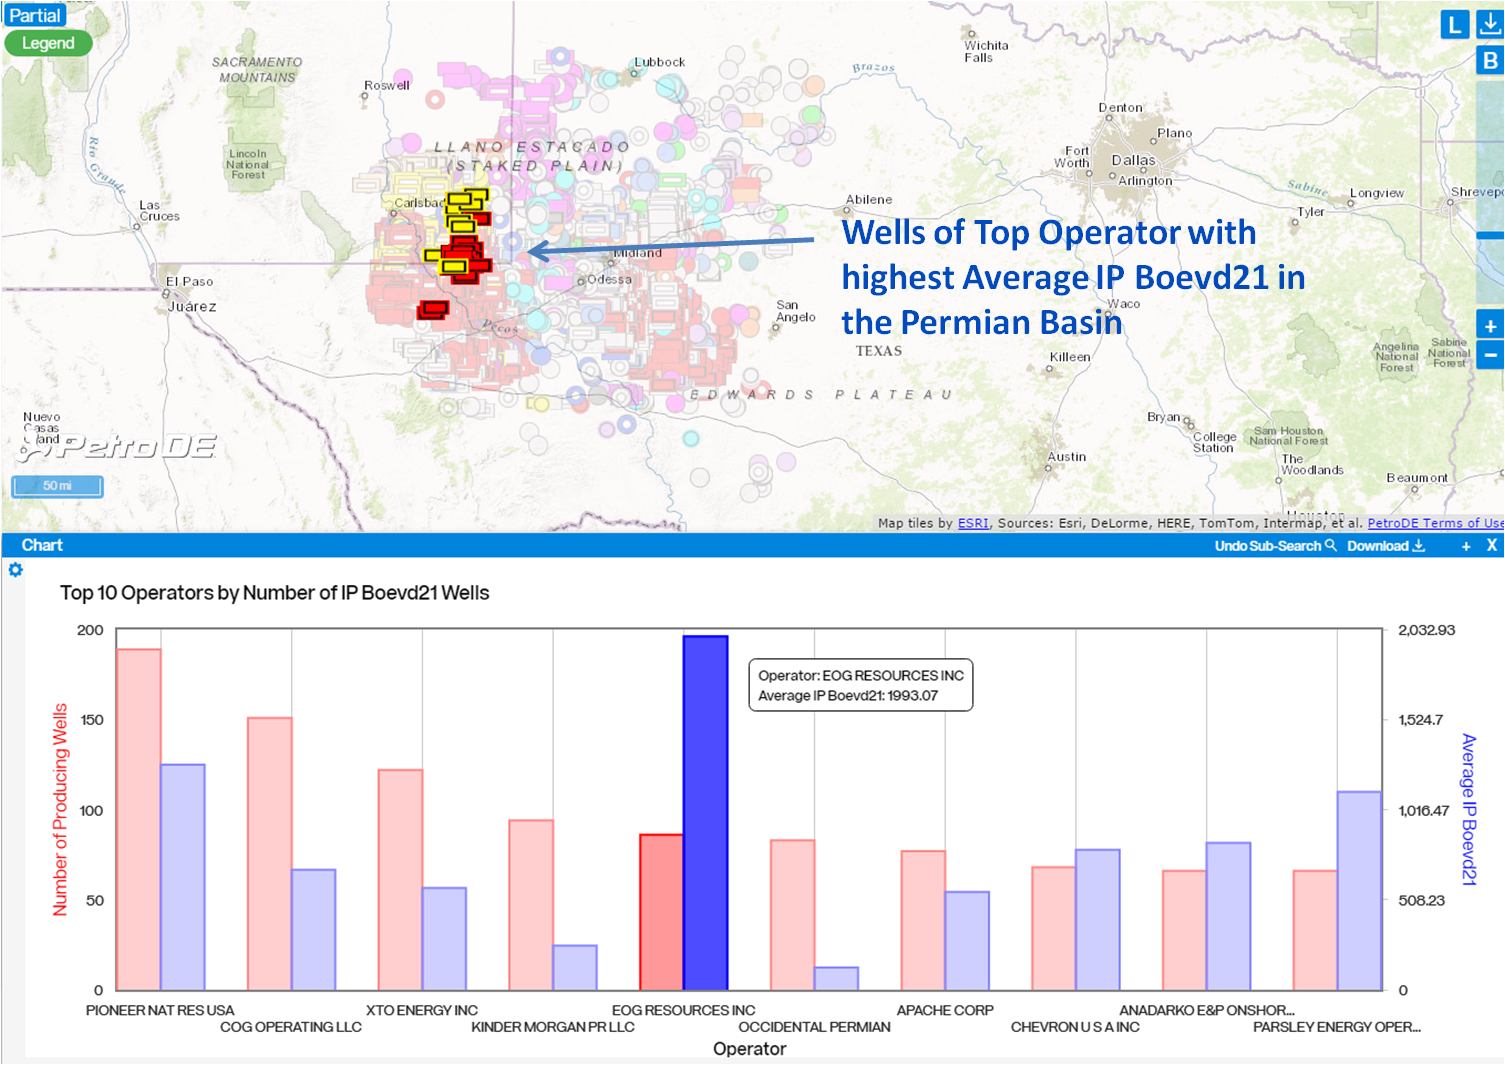
Click on any chart feature and the result is highlighted on the map with the remaining wells from the original search shown as transparent. This enables users to instantly compare where subsearch results are located with respect to the other wells in the original search. In the example below, we can quickly see the location of the wells for a top operator in the Permian Basin, EOG Resources.
3.11 Bar Charts
IP, Treatment, Peak Production, and custom charts are available under the Bar Charts option. An example IP bar chart showing Top Operators by Average IP Boevd21 Wells in the Bakken Formation is below.
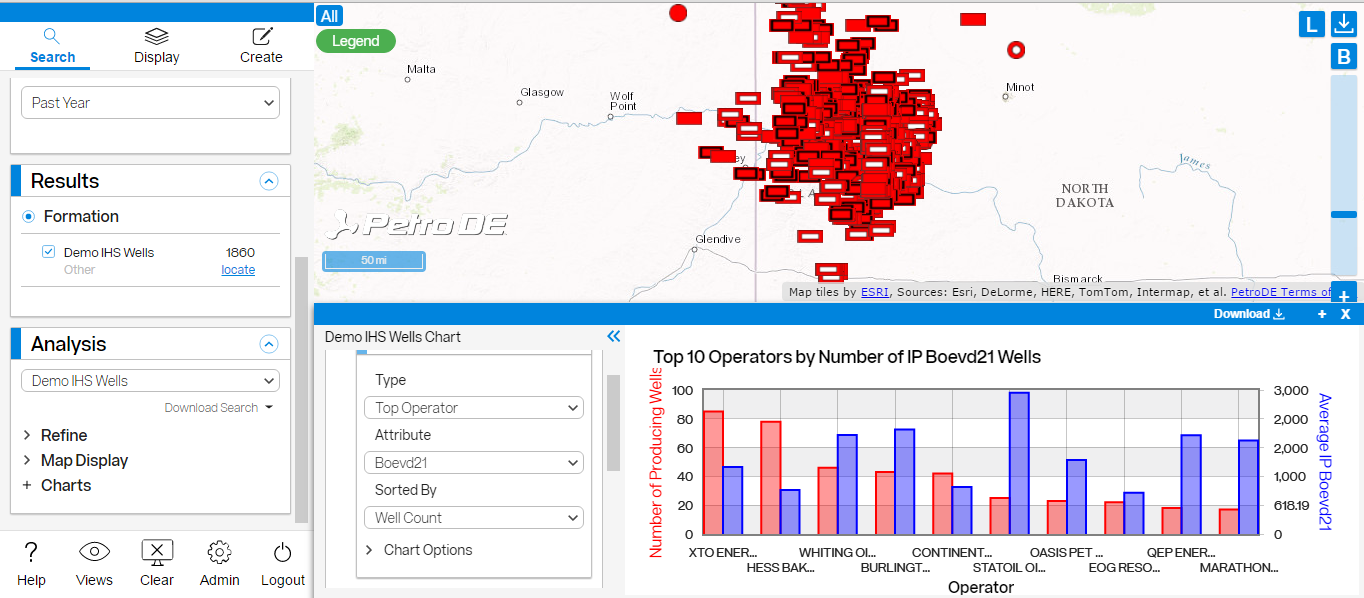
Click on any bar in the chart to show the well(s) represented by the bar on the map.
- Chart Options in the chart control panel - Allows you to toggle the grid lines on and off, and display values on bars.
- Download - downloads a zip file that includes a PNG file of the chart and a CSV file containing the data.
For a video tutorial on Bar Charts and Histograms, click here.
Custom Bar Charts
To Create a custom bar chart:
- Select Custom under Bar Charts and fill in the options, starting with number of desired bars.
- Choose the column for the X Axis. Available fields from the searched data will appear in the drop-down list in alphabetical order.
- Choose the column for the Y Axis. You may have two y axes (Y and Y2). If both Y and Y2 are used, two bars will appear for each x-axis point.
- Choose how to summarize the data, either None, Average, Sum, Count, Unique, Min, or Max.
- Choose the column for the Y2 Axis, if desired. If only one bar per x-axis point is desired, select None.
- To save a custom bar chart as a template, click the Save button. See the Saving and Retrieving Custom Templates below.
For a video tutorial on Custom Bar Chart Templates, click here.
An example chart showing the average IP Boevd21 and average IP GOR vs Fields in the Niobrara is shown below.

3.12 Histograms
IP, Treatment, Peak Production, and custom histograms are available under the Histograms option.
Histograms have the following well limits:
- date: 50,000
- number: 400,000
- text string: 120,000
An example of a histogram showing IP Oil is shown below.
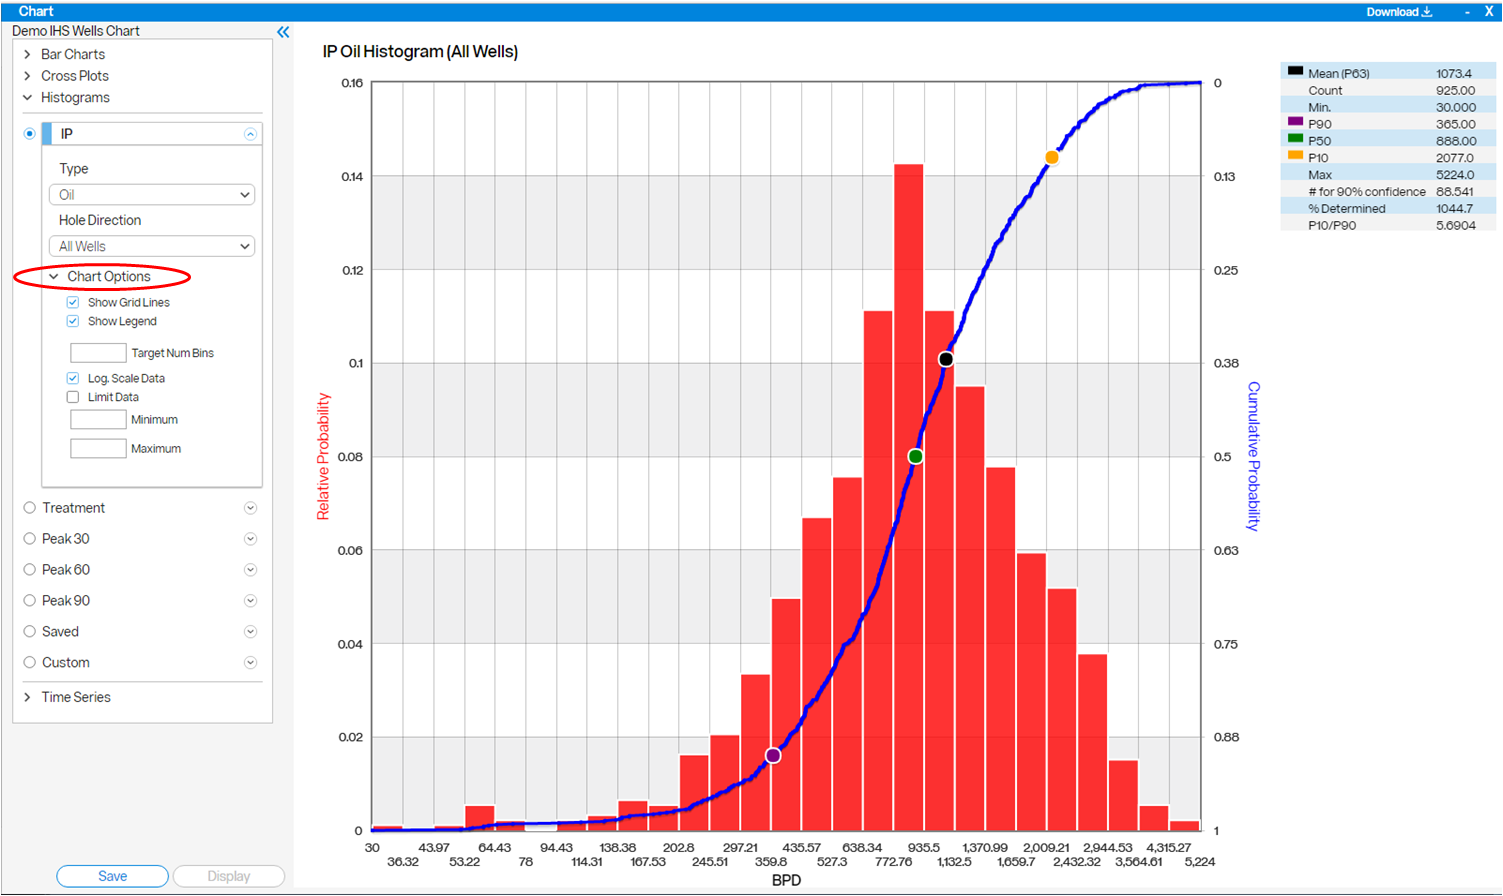
Click anywhere on the curve to bring up data for that point.
- Chart Options in the chart control panel - allows toggling grid lines, toggling the legend, selecting a target number of bins, toggling cumulative probability, toggling between linear and log scale, and setting max and min data values.
- Download - downloads a zip file that includes a PNG file of the histogram and a CSV file containing the data.
For a video tutorial on Histograms and Bar Charts, click here.
Custom Histograms
To create a custom histogram, select Custom under Histograms and select a bin column. Available fields from the searched data will appear in the drop-down list in alphabetical order.
To save a custom histogram as a template, click the Save button. See the Saving and Retrieving Custom Templates below.
An example custom histogram showing the Count vs Driller TD is shown below.

3.13 Time Series Charts
Time Series charts are limited to 10,0000 wells. Charts available under the Time Series option is dependent on the type of data being searched.
For Well Data, the options are:
- Permits Through Time by Operator or Formation
- Spuds Through Time by Operator or Formation
- Monthly Production Decline (Spaghetti) Charts
- Monthly Production Cumulative (Spaghetti) Charts
- ARPS Decline Projections
- Stretched Exponetial Decline Projections
- ARPS Cumulative Projections
- Stretched Exponential Cumulative Projections
- ARPS Combined Mean Projections
- Stretched Exponential Combined Mean Projections
- Custom
For Production Data, the options are:
- Aggregated Production by Operator, Formation, or Product
- Monthly Production Decline (Spaghetti) Charts
- Monthly Production Cumulative (Spaghetti) Charts
- ARPS Decline Projections
- Stretched Exponetial Decline Projections
- ARPS Cumulative Projections
- Stretched Exponential Cumulative Projections
- ARPS Combined Mean Projections
- Stretched Exponential Combined Mean Projections
- Custom
In the example below, Permits Through Time by Operator are shown from October 2010 through April 2017. We highlighted one operator, EOG, to see where they have permits.

The following chart is an Aggregated Production chart by Product. The second Y axis shows the water to oil ratio (WOR).

An example chart showing a Monthly Production Decline curve for liquids in the Bakken formation is shown below.

The green line represents the number of wells included in the calculation and the blue line is the average of all the wells included in the calculation. If you click on a black line at a given vertical line representing a given month, a red line will appear representing that single well.
An example chart showing a Monthly Production Decline curve for liquids in the Permian Basin Grouped By Operator is shown below.

The black line represents the number of producing entities. The map symbols are shown using Color By set to Operator.
An example chart showing Decline Projections for liquids in an area of the Eagle Ford formation using the Arps equation is below. The map view is colored by Operator. We normalized by Peak Month with a Perf Length of 10000. And under Projection Parameters, we set the Terminal Decline rate to 5% per year.

Click anywhere on the curves to bring up data for that point.
The chart below shows the Liquid Cumulative Production. The projected 40-year EUR values are shown in the list on the right side of the chart.

Click anywhere on the curves to bring up data for that point.
The chart below shows the Combined Mean Cumulative Production for gas, liquid, and water.

Click anywhere on the curves to bring up data for that point.
Time Series Charts have the following options:
- Chart Options in the chart control panel - allows toggling grid lines, legend, stats, linear / log scale, value lines, curve lines, and limiting the axes.
- Download - downloads a zip file that includes a PNG file of the chart and a CSV file containing the data.
Custom Time Series Charts
To create a custom time series chart, select Custom under Time Series. Fill in the options as follows:

3.14 Custom Cross Plots
To create a custom cross plot:
- Go to the Analysis panel and click Charts, then Cross Plots.
- Select Custom and fill in the options beginning with the column for the X Axis. Available fields from the searched data will appear in the drop-down list in alphabetical order.
- Choose the column for the Y Axis from the available fields in the searched data.
- Choose the column for the point label from the available fields. This will appear when you roll over the point with the mouse.
- To save a custom cross plot as a template, click the Save button. See the Saving and Retrieving Custom Templates below.
The following cross plot shows IP Boevd21 vs Perforation Length in the Bakken. Clicking on the highlighted well shows the current operator for that well.

Subsearch from Cross Plot or Map
Cross plot subsearches work in both directions. You can either point to a point on a cross plot and see it highlighted on the map or click on a well on the map and see its corresponding point highlighted on the cross plot. Note that the well selected must be in the defined parametsrs of the cross plot.

Subsearch a Group of Wells
To subsearch multiple points on a cross plot, simply use your mouse to drag a rectangular region over the desired points. In the cross plot below, we see that there is a group of wells with high IP and low lateral length. To see where these wells are located on the map, click and drag a rectangle around the group of wells in the chart and see them highlighted on the map. This works with Color By. With the map symbols colored by Operator, we see that all of these wells belong to EOG Resources.

3.15 Saving and Retrieving Custom Templates
To save a custom template:
- Create a custom chart as described in one of the above sections.
- Click Save and enter a name.
- The template is stored in the Saved section of the type of chart it was created under.
- Retrieve a saved custom template by clicking on Saved in the chart section of type for which it was created. Click the drop-down arrow and select from the list.

4. Display Tool
4.1 Selecting Layers to Display
The Workbooks under the Display tab contain data layers supplied by PetroDE plus data layers added by users. To find a layer quickly, enter a keyword into the Filter Layers box. To select and unselect layers to display on your map, toggle the tick box next to it. To list all the layers currently active, click the Active Layers 
Layers are designated with the following symbology:

4.2 Adding Data Folders
To add a folder, open the Display tab and select the desired workbook for the new folder. Folders can be added at any level within a workbook. Click the down-arrow next to the workbook or folder name where the folder will be added. Click Create Folder and enter the name of the folder.

4.3 Uploading Data Layers
Shapefiles, CSV files, KML/KMZ files, and GeoTIFF files are easily added in either the Display tab or the Create tab. In the Display tab, right click the drop-down arrow next to the desired folder name and select Create Layer. In the Create tab, select Create Layer. The Create Layer wizard will guide you through the process. A detailed description of the Create Layer utility is described here.
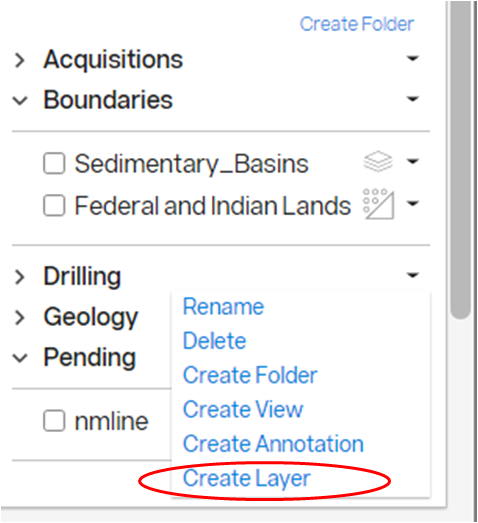

Layers uploaded by the user have the following options. Other users cannot rename or edit styles of a shared layer.

4.4 Moving and Copying Data Layers
Layers can be moved by clicking on the layer and dragging to the desired location.
Layers can be copied to another folder or workbook by selecting Copy Layer To from the drop-down menu next the layer and then entering the desired workbook location. Deleting a copied layer from one location does not delete it from other locations.
4.5 Renaming Folders and Data Layers
To rename a layer, click the drop-down menu next to the layer you wish to rename and select rename. Only administrators and the user who created the layer can rename a layer.
4.6 Deleting Folders and Data Layers
Delete layers from the display folders as follows:
WARNING! Layers are shared so deleting a layer removes it for everyone with access to the workbook where it is contained. Deleting a copied layer from one location does not delete it from other locations.
- Under the Display tab, find the folder containing the layer(s) you want to delete and click the drop-down menu for the layer.
- Select Delete and answer Yes if you are sure you want to delete.
4.7 Editing or Adding Data Layer Styles
To edit the symbology for a data layer, click the drop-down next to the layer and select Edit Styles. This is where symbol shapes, colors, and transparency can be changed and new style groups can be added. Only administrators and the user who created the layer may edit the styles. For example, two columns have been given symbology in the Current Term Leases layer shown below. Styles have been created for both the Grantee and Grantor columns, with Grantee being the default. Users can select the column they wish to view by selecting it in the Map Display / Symbols list.

Styles are created in the Create Layer wizard when either uploading a new layer or editing the styles for an existing layer, thus allowing users the ability to change layer symbology or add styles for another column at any time.

4.8 Editing Existing Annotations
To edit an existing annotation, click the drop-down next to the annotation layer and select Edit Annotation. The Create Annotation wizard will appear. When finished editing, click the green Save button.
4.9 Setting a Search Default Layer
To set a data layer as a default layer to be searched, click the drop-down next to the layer and select Set as Search Default . This will set the layer as a default layer to be searched in every session.
4.10 Automatically Update a Layer
The layer auto-replace feature allows a user to replace an existing layer with an updated version of the same layer. It is intended for use with layers that are updated by their source periodically. This utility is for replacing an entire layer already loaded into PetroDE with a new version of the layer. To load the updated layer into PetroDE, follow the steps in this section.
Initial Access
Obtain an AWS access key id, AWS secret access key, AWS s3 bucket, and AWS s3 path by sending a request for layer auto-replace credentials to support@petrode.com.
Get a Manifest
Under the Display tab, select the layer you wish to update and click the drop-down arrow. Select Get Upload Manifest. The manifest file with the file extension .psm (PetroDE signed manifest) will be downloaded to your computer.

The manifest file authorizes you to update the layer it is associated with. Anyone who possesses the file, can update the layer. Keep the manifest file secure. If unauthorized parties have access to your manifest file or for any other reason, you need the manifest to be revoked, contact PetroDE support at support@petrode.com. Manifest files can easily be invalidated on the PetroDE system.
The manifest file contains a signature within it which prevents any changes to be made to the file. If any change is made to the manifest file, the manifest file will become invalid and updates will no longer be permitted. Only one valid manifest per user per layer is permitted at any given time. If a new manifest file is issued to a user for a particular layer, all previous manifests for that user/ layer combination are invalidated.
Prepare the File
The layer to be updated must have a data file of the same format (e.g., shapefile) as your original uploaded layer. The updated layer must be a zip file that includes the new layer and the manifest .psm file. If the layer is a CSV, the zip file must contain the .csv file and the .psm file. If the layer is a shapefile, the zip file must contain the .shp, .shx, .dbf, .prj and .psm files. The filename does not have to match the name of the original uploaded file. You must have only one layer and one manifest file per zip file.
PLEASE NOTE: The layer source data CANNOT have any changes to the column name, column type, or number of columns. You cannot add or delete columns. It is OK to have an empty column if a column no longer has values. Columns selected to be searchable and to be displayed in the and pop-up text balloons are specified when a layer is first uploaded and cannot be changed, This prevents errors in linked layers, saved views, etc.
Replace Layer via GUI
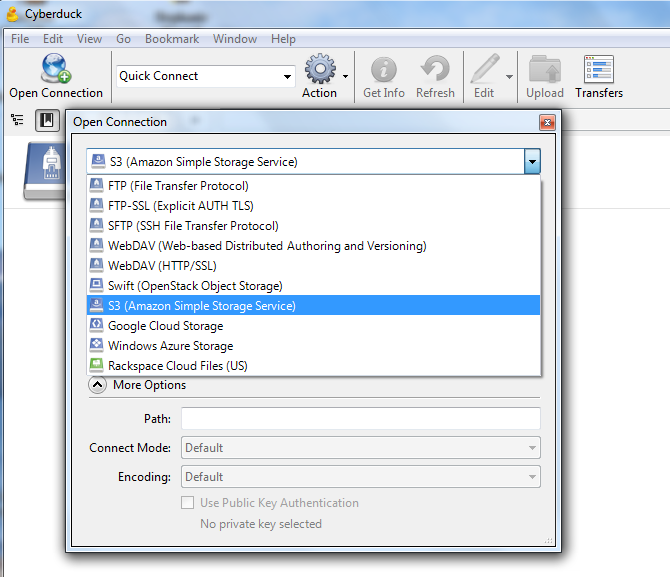
- Download and install cyberduck https://cyberduck.io/ .
- Start Cyberduck.
- Click Open Connection.
- In the top select box, click the drop-down button and select S3 (Amazon Simple Storage Service).
- Enter the access key id and secret access key given to you by PetroDE support. Click more options and enter the path you were provided by PetroDE support.
- Click the Connect button.
- Drag and drop your zip file into the cyberduck file browse window. The new layer is now available in PetroDE.


Auto-Replace Layer Programmatically
There are many existing libraries and utilities available in many languages (Java, JavaScript, .NET, PHP, Python, Ruby, PowerShell, Bash, and others) for uploading a file to an Amazon AWS S3 bucket. An example is provided here in Python.
- import boto3
- session = boto3.Session(aws_access_key_id='XXXXXX', aws_secret_access_key='XXXXX', region_name='us-east-1')
- s3 = session.client('s3')
- s3.upload_file('datafile.zip', 'bucket', 'path/datafile.zip')
For other languages, refer to these links:
- Other languages: http://aws.amazon.com/code
- Powershell: https://aws.amazon.com/powershell/
- Bash: https://aws.amazon.com/cli/
Notifications
Upon completion of a layer update (success or failure), a notification email is sent by PetroDE, except in the case of an invalid manifest. If the manifest is invalid, notifications cannot be sent to you because the manifest is what identifies and authenticates you. If you would like to be notified of layer updates to a particular layer or all layers at your company, regardless of who initiates the layer update, please contact PetroDE support at support@petrode.com. Notifications of this variety can be configured by the PetroDE staff.
5. Create Tool
5.1 Creating a View
To save the current view, select Create View under the Create tab. Enter the desired Workbook/Folder from the Workbook drop-down list and enter a name. Then click the Save button. The view will be saved in the workbook/folder specified and can be retreived under the Display tab.
5.2 Creating an Annotation
To draw an annotation, select Create Annotation under the Create tab. To save for later use, type a name in the name field and select a workbook to place it in. Then click the Save as New File button.
The Revert button will clear the annotation to the last saved version.

Drawing Rectangles and Circles
- Select the Rect. or Circle tool.
- Select the Mode, either Draw or Specify Dimensions.
- If Draw is selected, click on the desired location on the map and drag the mouse until the desired size is obtained.
- If Specify Dimensions is selected, the following menu appears. Enter desired coordinates and / or dimensions and click Add Rectangle.
- Enter the desired fill and outline colors and select the desired opacity.
- Click the Save button to save the annotation to a workbook if desired.

Drawing Polygons
- Select the Poly tool, then click the desired location on the map. Click once for each point of the polygon, then double click the final point to close the polygon.
- Select fill and outline colors and desired opacity.
- Once a polygon is drawn, the rotate tool appears inside it. Click this tool to rotate the polygon.
- Click the Save button to save the annotation to a workbook if desired.
Drawing Freeform
- Select the Free tool and click and drag the mouse to draw any kind of shape or line.
- Select the line color and width.
- Click the Save button to save the annotation to a workbook if desired.
Drawing Lines
- Select the Line tool.
- Select the Mode, either Draw or Specify Dimensions.
- If Draw is selected, click on the desired location on the map and drag the mouse until the desired size is obtained.
- If Specify Dimensions is selected, Enter desired coordinates and / or dimensions and click Add Line.
- Enter the desired line color and width.
- Click the Save button to save the annotation to a workbook if desired.
Drawing Arrows
- Select the Arrow tool, then click the mouse on the desired location on the map and drag until the desired length is obtained.
- Select the line color and width.
- Click the Save button to save the annotation to a workbook if desired.
Adding a Placemark
- Select the Mark tool.
- Enter a name and description in the respective fields. The description will appear when the placemark is clicked on the map (after the annotation is saved).
- Select the Mode, either Draw or Specify Dimensions.
- If Draw is selected, click on the desired location on the map for the placemark.
- If Specify Dimensions is selected, enter the desired latitude and longitude coordinates and click Add Placemark. In this example, the desired coordinates a placemark named My Place are 38 degrees N and 99 degrees W.
- Enter the desired icon and text colors and select the size.
- Click the Save button to save the annotation to a workbook if desired.

Adding Text
- Select theText tool.
- Enter the text in the Text field.
- Select the Mode, either Draw or Specify Dimensions.
- If Draw is selected, click on the desired location on the map for the text. It will be centered at the position of the mouse.
- If Specify Dimensions is selected, Enter desired coordinates and click Add Text.
- Enter the desired text color and size.
- Click the Save button to save the annotation to a workbook if desired.
Move, Resize, or Rotate
Select the Edit tool to move, resize, or rotate. Blue points appear on the annotation. Click on these to adjust the shape and size. Click anywhere on the shape and drag to move. Click and drag the rotate arrow to rotate, or click once to flip.
Undo
Select Undo to undo the last annotate action. Undo can be clicked repeatedly to undo consecutive actions.
Pan
Select Pan to enable the mouse to move the map display within the window.
Erase
To remove annotation features, select the Erase tool. Then click an object once to see a blue point(s). Then click on a blue point to remove either a segment or the object.
5.3 Creating Layers
Shapefiles, CSV files, KML/KMZ files, and GeoTIFF files can be uploaded in either the Display tab (under a folder) or the Create tab. Selecting Create Layer in either location will bring up the Create Layer Wizard. Before uploading a file, consider the following:
- Which columns in your file should be included (searchable)
- Which columns should appear in the pop-up balloon
- Which column to base the style properties on. Only one column can be used for the style properties.
- Ensure that the data in all columns to be included is of only one type - either number, text, or date. If a column includes more than one type (e.g., both number and text), edit the data in the column to be only the desired data type. For example, a file contains a column for IP FCP that contains the pressure number plus the units (1200 PSIG). Edit the data so that the units only appear in the header and only the number remains in the data.
The steps for creating a new layer are as follows:
- Go to the Create tab and select Create Layer.
- Select File to Upload:
- Must be uploaded using a zipped folder file (.zip) containing the .shp, .shx, .prj and .dbf files.
- The prefix for these files must be identical (e.g., BasinOutline.shp, BasinOutline.shx, BasinOutline.prj, etc).
- Click the Choose File button to begin uploading your file, or drag and drop your file on top of the Choose File button until it changes hue. Then select the workbook you want the layer to appear in. Choose a layer name if different from the file name uploaded.
- Specify searchable columns, text balloon columns, text balloon label column and label column.
- Click the Finish button. If there are any duplicate columns or errors, you will be notified with a "Resolve Errors" message. Toggle from one error to the next until all errors are resolved.
- Input Layer Style: The values for the column appear in the window on the right. Select the Value from the list by clicking on it and then select an icon from those available or select a shape and color. Select Transparency. The New Style will appear on the left side of the screen. To add another style, click the New Style button. Click the Finish button when done.
- Confirm Style Rules: Verify the styles you created are correct and click Finish.
Shapefile requirements:
For a video tutorial on how to upload a shapefile, click here.
5.4 Creating a Linked Layer
Shapefiles and/or CSV files can be linked if they share a common column. At least one of the layers must have geographic properties such as lat and lon.
To link two data layers:
- Ensure both layers have been uploaded to PetroDE and know their filenames.
- Select the Create tab, then select Create Linked Layer.
- Enter a name for the new linked layer in the Linked Layer Name box.
- Select the filenames of the layers to be linked from the drop-down list in each of the two columns.
- Select the unique column on which to link.
- Select the column presence for each layer.
- Select the layer to use for geometry and date entries.
- Select spiderfy column and multiple link columns if desired (keeping the Default is suggested).
- Click the Create button and follow the Create Linked Layer Wizard to select the layer style.
For a video tutorial on how to create a linked layer, click here.
6. Administration
6.1 Adding a New User
Only users with Company Admin status can add a new user.
- To add a new user, click the Admin
icon located on the bottom toolbar, then select the Create User button in the pop-up window.
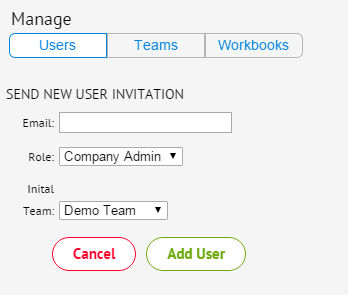
- On the Create User screen, enter the user's email address in the box provided. Then select the user's role (either Company Admin or User) and if desired, a Team. Click Add User. An email will be sent to the user with setup instructions. Note that the user can be added to a team at any time by clicking Team from the Manage panel as described here.

Account Types
User: User can change items related to their own account only (i.e. their own password).
Company Admin: User has the ability to change things related to all accounts in the company (i.e. add users, teams, and workbooks, change user passwords, delete users, change teams, delete teams, or delete workbooks).
6.2 Creating a Team
Only users with Company Admin status can add a team. For a video tutorial on how to create teams and workbooks, click here.
- To create a new team, click the Admin
icon located on the bottom toolbar, then select Teams.
- Click the Create Team button in the pop-up window.
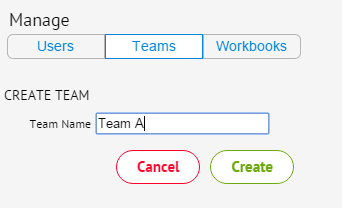
- Enter a team name and click Create.
- On the Create Team screen, select the team name and then add users to the team from the list in the right column. Team members will be placed in the center column.



6.3 Creating a Workbook
Only users with Company Admin status can add a workbook. For a video tutorial on how to create teams and workbooks, click here.
- To create a new workbook, click the Admin
icon located on the bottom toolbar, then select Workbooks.
- Click the Create Workbook button in the pop-up window.
- Enter a workbook name and click Add Folder if folders are desired. Folders can be added at anytime.
- Click the Add Layer drop-down list to see available layers that can be added to the workbook.
- To give access to teams, select them from the list on the right side of the window under Teams without Access and then click the add button.


6.4 Managing Access
Company Administrators can assign permissions to individual users as well as assign users to teams and workbooks. To access the Manage panel, select the the Admin 

Manage Users
To manage existing users, select Users in the Manage panel. The following can be managed:
- ROLE - To assign a user role, select the ROLE drop-down menu next to the user's name and select either User (limited access) or Company Admin.
- Password - To reset a user password, select Reset next to the user's name and enter the new password.
- Delete - To remove a user from PetroDE, click the X at the end of the row with their name.
Manage Teams
To manage existing teams, select Teams in the Manage panel. Then select the team you wish to manage.
- Add Team Members - To add users, find the user in the list in the right column and click add under the login name of the user.
- Remove Team Members - To remove a user from a team, find the user in the center column and click the del button under the login name.
Manage Workbooks
To manage existing workbooks, select Workbooks in the Manage panel. Then select the workbook you wish to manage.
- Add Folders - To add a folder to the selected workbook, click Add Folder and enter a name for the folder.
- Add Layer - To add a layer to the selected workbook, click Add Layer and select from the available list of layers in the drop-down menu. Layers can be moved to the desired folder within the workbook after they are selected by clicking and dragging the layer.
- Remove Folder or Layer - To remove a folder or layer, click the X next to the folder or layer name.
- Add Teams - To add a team, find the team in the list on the right under Teams Without Access and click add under the team name.
- Remove Teams - To remove a team with current access, find the team on the right under Teams With Access and click the del button under the team name.
6.5 Changing Your Password
Users with limited access can change their own password, click the Admin 
7. Workflow Examples
7.1 Finding Significant IP Wells
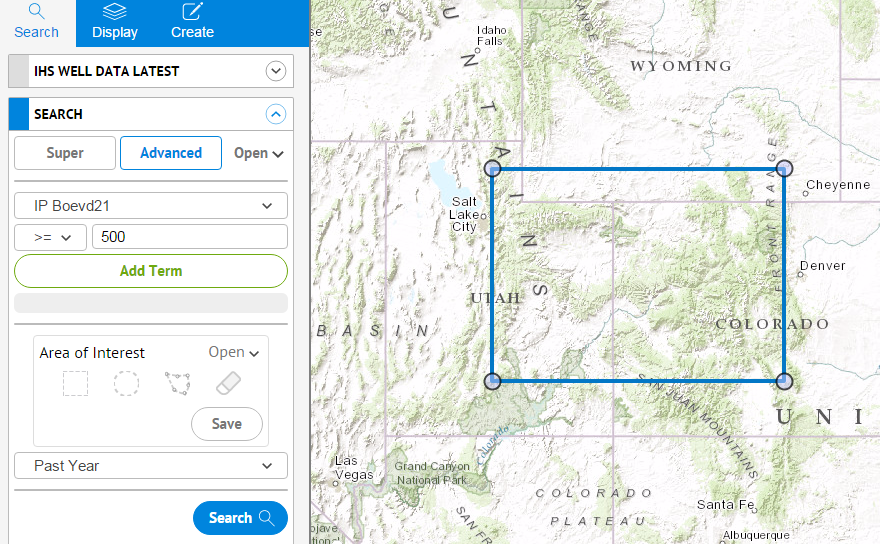
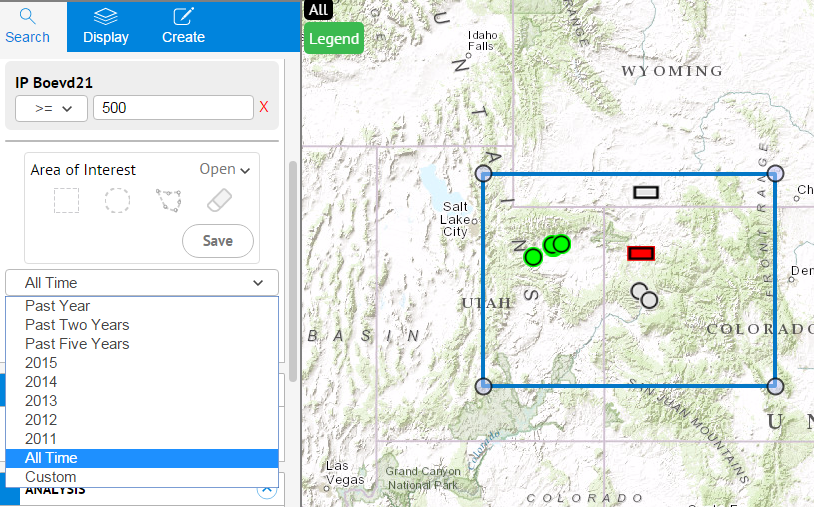
This example shows how to search for wells in a specified area of interest on the Colorado Utah border that have an IP of 500 or more barrels of oil equivalent on a value basis (BOEVD21). Boevd21 uses a ratio of 21, which is like gas selling for $5/mcf and oil for $105/bbl.
- Select the data layer to search IHS Wells.
- Create an Area of Interest by selecting the rectangle tool in the Area of Interest toolbox and click and drag to select the desired area.
- Click Advanced under the Search tab.
- Click the drop-down list next to API for the available fields and select IP Boevd21.
- Select >= for the operator and 500 for the value. This will search for wells that have an IP of 500 or more barrels of oil equivalent on a value basis.
- Click the Search
button.
- Change the time period for your search by clicking the drop down list next to Past Year and changing to All Time. This will increase the number of wells found.
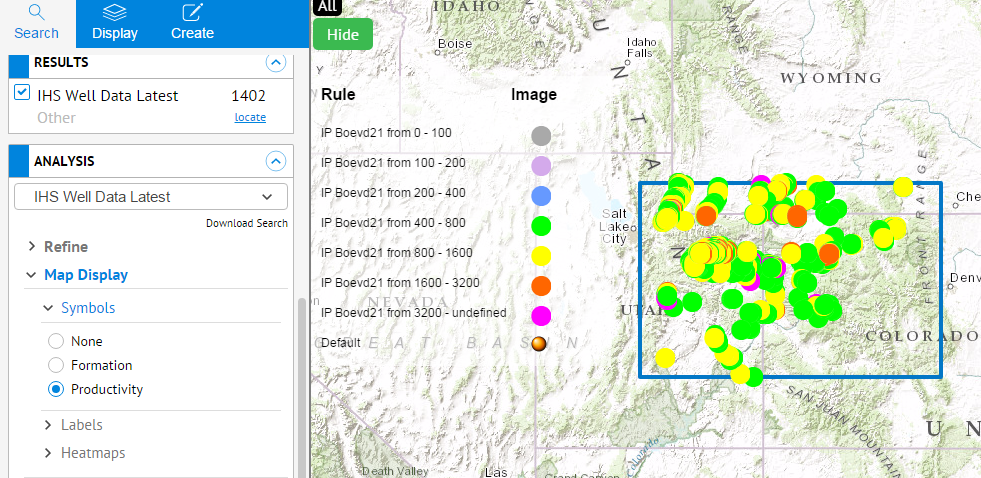
- To see the wells color coded by productivity, scroll down to the ANALYSIS panel and select Map Display then Symbology then Productivity. Click the
 button to see the color codes defined.
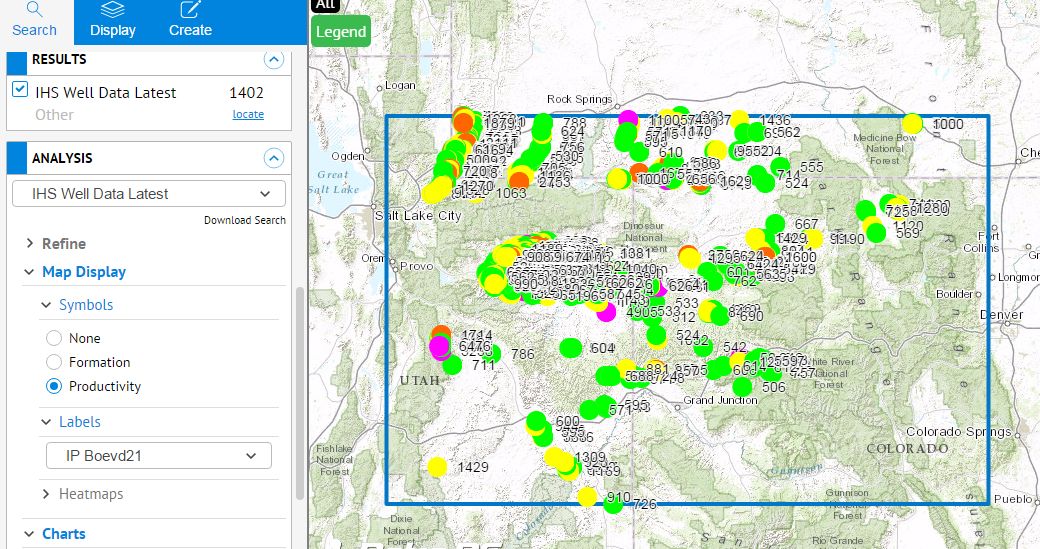
 - Under Map Display, click Labels and select IP Boevd21. This places the IP Boevd21 value next to each well.
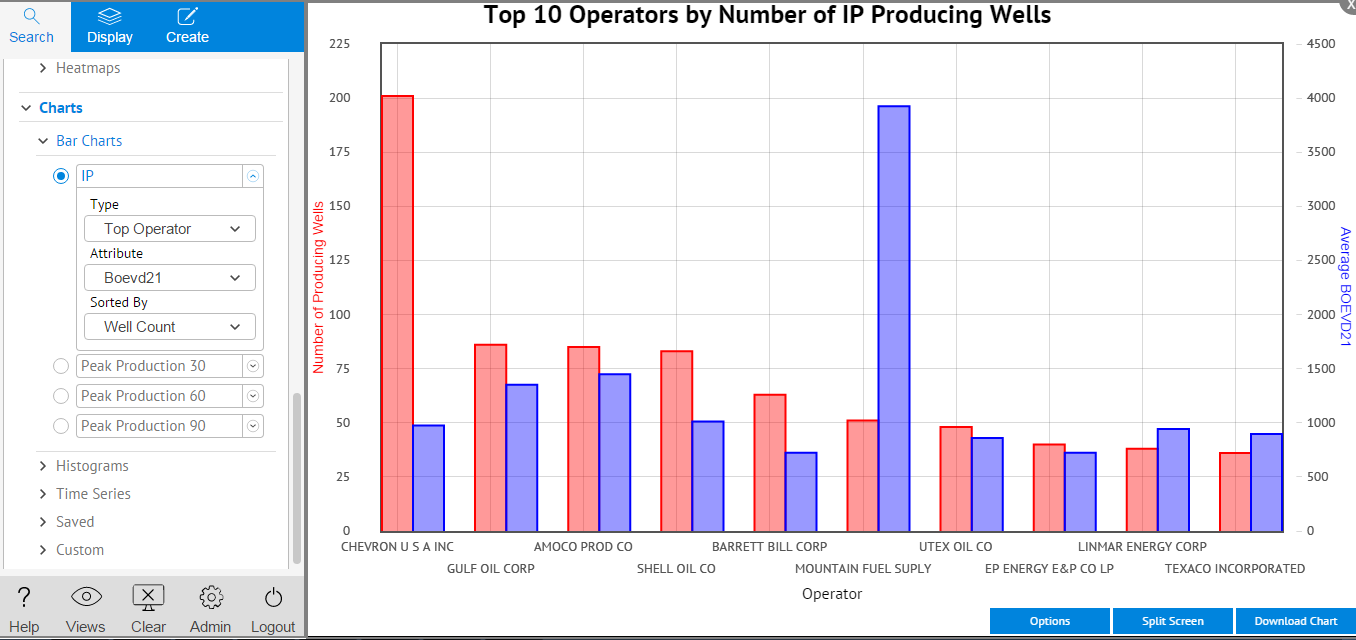
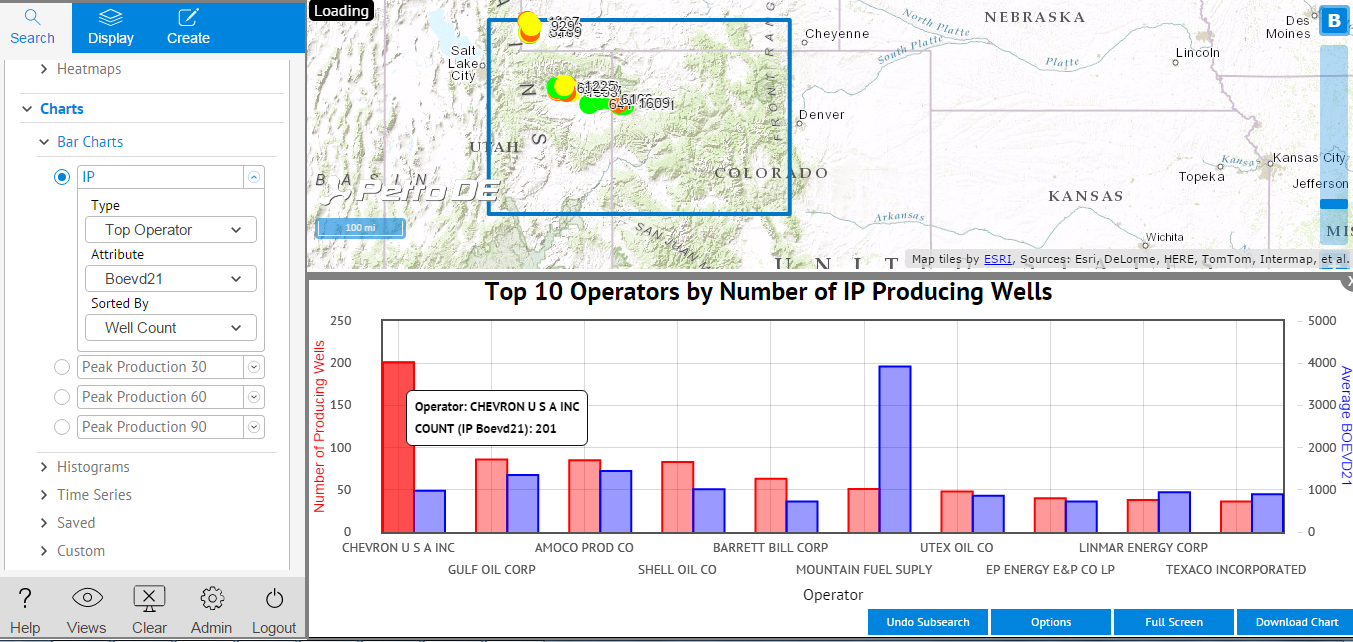
- To see the wells compared on a chart, expand Charts and select Bar Charts. Select IP and then enter Top Operator, Boevd21 and Well Count in the fields as shown. This bar chart shows the operators with the most wells and the operators that have the highest boevd21 in this area. Click Full Screen in the lower right corner to see the chart full size.
- Click Split Screen in the lower right corner to see the chart and the map together.
- Click on any bar in the chart to show just that well or wells represented by the bar on the map.
- To download the chart data, click Download Chart in the lower right corner. This downloads a PNG file of the chart as well as a CSV file of the data.
7.2 Searching by Hole Direction
To search for wells that have a certain hole direction in the Bakken Formation:
- Under the Search tab, select Super and enter Bakken in the search field. This returns 3169 wells.
- Scroll down to the ANALYSIS panel and click Refine.
- Select Hole Direction. This returns 4 possible choices. Unselect (All) and select the hole direction you wish to see, e.g. select V to see the vertical wells displayed.


7.3 Searching by Perforated Length
This example shows how to find wells in the Eagle Ford formation with a perforated length between 5000 and 7000 feet.

- Select Advanced Search and select Formation from the field drop-down list.
- Select Starts or Ends with (s/e) and enter Eagle Ford in the search box.
- Select Add Term and select Perforation Length from the field drop-down list.
- Select >= as the operator and enter 5000 in the search box.
- Select Add Term and ensure Perforation Length is still selected.
- Select <= as the operator and enter 7000 in the search box.
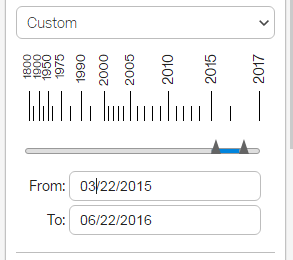
- The search returns a result for the past year. If you want to see the result for a different time period, e.g., the past three months, simply change Past Year to Custom and enter a new beginning date.
7.4 Searching for Top Operators by Basin
This example shows how to find the top operator in the Denver Basin.

- Select Advanced Search and select Basin from the field drop-down list.
- Select Starts or Ends with (s/e) and enter Denver in the search box.
- Click Search
.
- To zoom to the layer, click locate under the number of wells returned in the Search Results.
- Scroll down to the ANALYSIS pane and select Charts.
- Select Bar Charts then IP.
- Select Top Operator, Boevd21 and Well Count . The result is shown below.

7.5 Drawing a Pad Plan
Use the annotation tool to draw a pad plan as shown in the following steps.
For a video tutorial on how to draw a pad plan using the annotation tool, click here.
- On the map display, zoom into the location where you wish to put your well pad. Click on the
above the slider bar and change the base map to Esri World Imagery.
- Under the Create Tab, select the Create Annotation.
- Enter a name for the annotation layer and select the workbook under which it will be saved. Click the Save as New File button.

- If there are buildings in the area that require a minimum buffer distance , select the Circle tool and for Mode, select Specify Dimensions. Scroll down to Dimensions and enter the required buffer distance for the radius. In this example, we use 500 feet.
- Select the desired colors and opacity.
- Click on the building to place the circle. Repeat for all buildings in the area.

- Select the Rect. tool and for Mode, select Specify Dimensions. Scroll down to Dimensions and enter the desired dimensions of the pad Width, Height and Angle. In this example, we use 500 by 600 feet with an angle of 20 degrees.
- Select the desired colors and opacity (e.g. yellow with black outline and 40 % opacity).
- Click on the map where you want the pad centered.
- If you want your pad at a specific latitude and longitude, enter them in the Latitude and Longitude boxes. and click the Add Rectangle button. This centers the rectangle on that axis point.


Add a Road:
- Click the Line tool.
- Click the mouse at the starting point for your road and double click the mouse at the end point. In this example we drew a line that is 357.24 feet.
- Select the line color and width.
Add a Label:
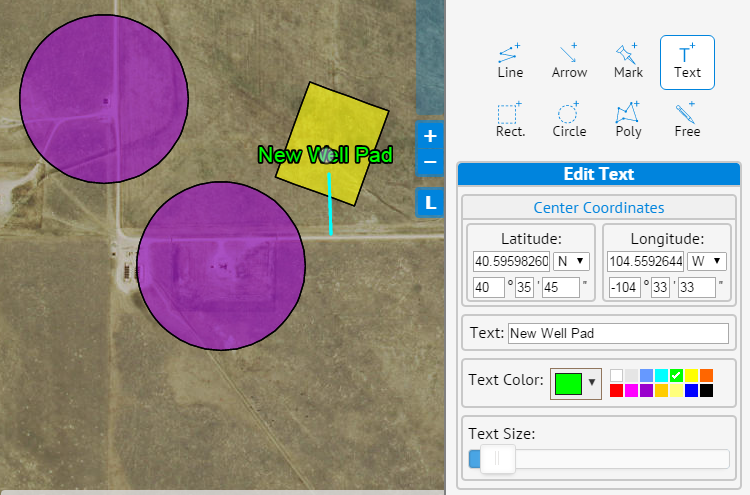
- Next, add an identifying label by clicking the Text tool. If it is desired to center your text at a specified Latitude, select the Specify Coordinates option for Mode.
- Enter the name of the pad in the Text field.
- Select the desired text color and size.
- Click the location on the map to place the label.
7.6 Comparison of Horizontal and Vertical Productivity
This example compares vertical and horizontal well productivity in the Niobrara Formation.
- Select Advanced Search and select Formation from the field drop-down list.
- Select Starts or Ends with (s/e) and enter Niobrara in the search box.
- Click Add Term and select Hole Direction from the field drop-down list.
- Select Contains as the operator and enter H in the search box.
- Change the time period by clicking the time period drop-down under the area of interest tools. Select All Time.
- Click Search
.
- Scroll down to the ANALYSIS panel and select Charts and then Histograms.
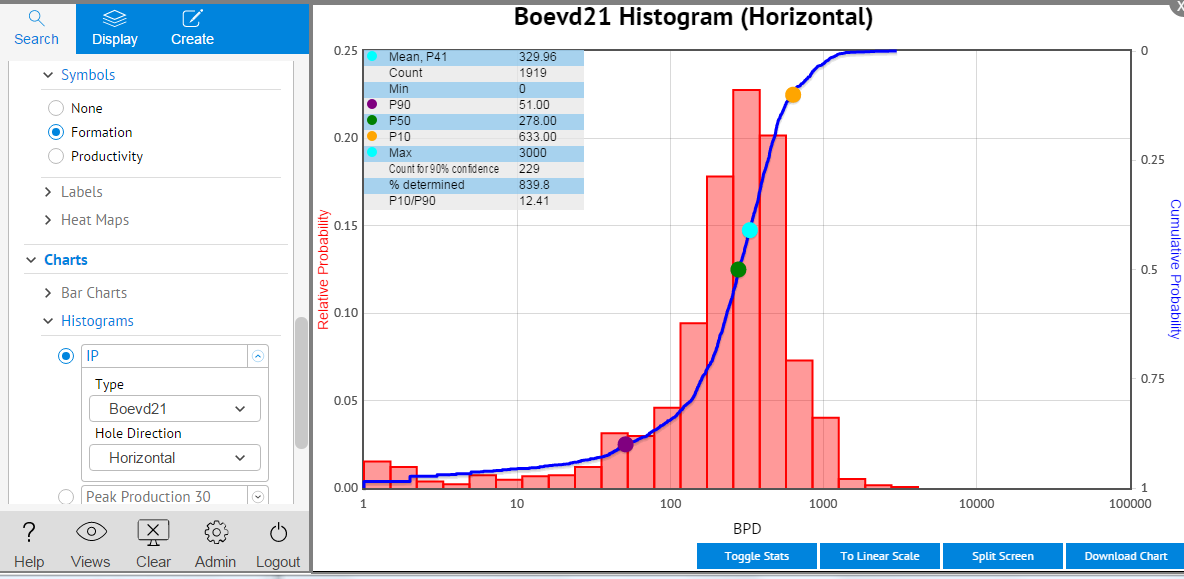
- Tick IP and select Boevd21 and Horizontal. Click on Full Screen at the bottom of the screen to see the histogram full size.
- Change the Hole Direction in Step 4 to V and repeat the last step selecting Vertical for the hole direction and compare charts.


7.7 Estimating EURs
The time required for this workflow is as little as 20 minutes depending on data available. Use this workflow to:
- Compare Monthly Production
- Analyze Decline Projection Data
- View 30-Year Estimated EUR Projections
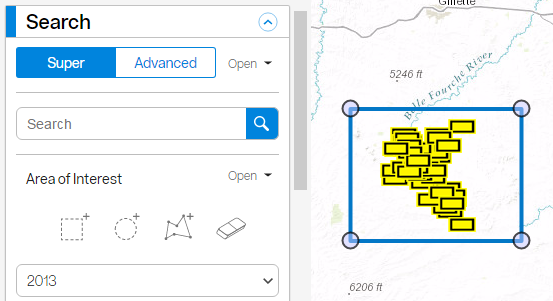
- Search the IHS Production data layer for the area of interest. In this example, we will search the Powder River Basin in 2013. Go to the Search tab and type IHS Production in the top filter box. Then type Powder River in the Search box and 2013 in the time period box. Click the Search icon.
- Next, scroll down to the Analysis panel and select Refine to refine the results by whatever columns are appropriate for your work, such as Formation, Reservoir, Play, Hole Direction, Prod Zone Code, etc. We will refine by Hole Direction and Reservoir. In the Choose Column box, type Hole Direction and select Horizontal. Then type Reservoir in the Choose Column box, and tick the Reservoir you are interested in viewing.
- Now scroll down to Charts and select Time Series -> Monthly Production. Look at both types of Monthly Production charts available: Decline and Cumulative for any of the reservoirs of interest. Be sure to click the Display button for each new chart. If there are not enough wells to generate a chart, you can widen your search criteria and/or change the time period. The example here looks at the Turner Reservoir in 2013.
- Questions to ask about the Monthly Production chart: Does the chart show a consistent number of wells for a year or two? Is the mean curve at all smooth? Note that the gray lines represent individual wells and when clicked, it will turn red and the well will be highlighted on the map. This is useful for seeing where a particularly good well is located.
- Zoom into your area of interest on the map. Using the Area of Interest tools located near the top of the search panel, draw an AOI over your area of interest.
- Or, if you have an API list from another program or source, go to Advanced Search, select API (API Ten Digit if you have 10-digit API numbers), then select In as the operator and copy and paste the API numbers into the box. Ensure the numbers are in text format and that there are no decimals or scientific notation. Click Add Term followed by the Search icon.
- Scroll down to Charts -> Time Series and select Decline Projections. Choose either Arps or SE for the equation type and choose the production stream of interest. Click Display.
- Mean - the average daily production rate for each month
- P10 - the value where 10 percent of the outcomes (or values) are greater than this value
- P50 - the median of a distribution, such that 50 percent of the outcomes are greater and 50 percent of the outcomes are less than this value
- P90 - the value where 90 percent of the outcomes are greater than this value
- Check with an engineer familiar with the area to see if the curve fit parameters match their knowledge of the area.
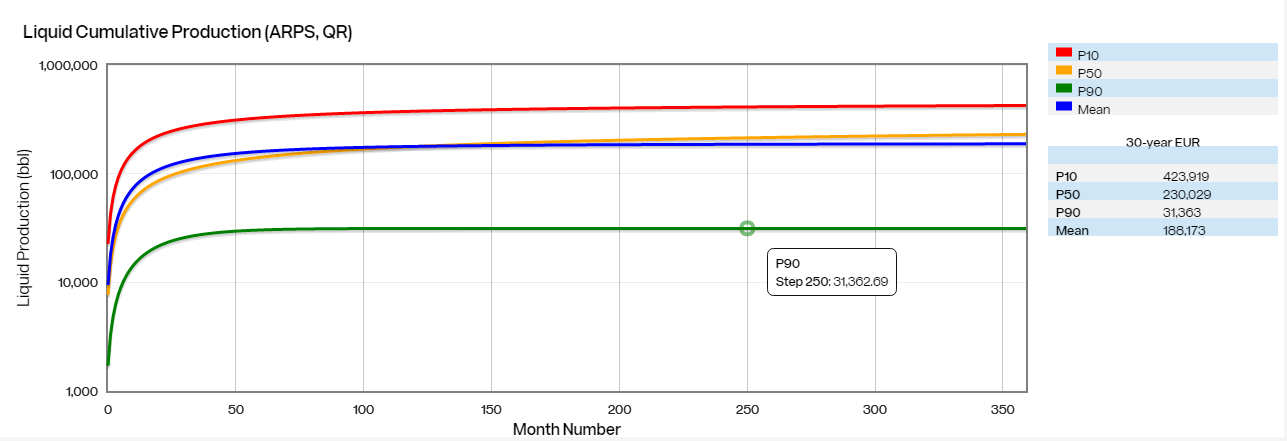
- View Estimated 30-Year EUR Projections: Select Cumulative Projections from the Time Series chart selections. Choose the equation type (Arps or SE) and the production stream. Click the Display button. 30-year EURs are projected and listed in the legend on the right. Cumulative projections for different time periods can be viewed by sliding the curser over the desired line.
- Look at the Combined Mean by choosing Combined Mean in the Production box. Click the Display button. This chart shows the calculated mean for Liquid, Gas, and Water and the estimated 30-year EUR for each.




PetroDE calculates projected production for any given set of wells. There are four Decline Projection curves generated to illustrate the result:
The mean projection is estimated using the least squares fit method and the P10, P50, and P90 projections are estimated using quantile regression. P10 and P90 give a sense of the variability in the data.

7.8 Assessing an Acquisition
The time required for this workflow is as little as 30 minutes depending on data available. Use this workflow to:
- Verify accuracy
- Quantify risk and reward
- Inform the go/no go decision
Integrate Information from the Acquisition on the Map
- Begin by placing all available information on the map. In this example, we have located a county, some geologic features, and an outline of the area of the acquisition. The green Resource Play outline was created using the Poly tool under Create Annotation under the Create tab.
- If desired, place a marker using the Mark tool with a description that may include links to supporting documents for easy reference. Click the Pan tool when finished. Save the Annotation by clicking Save As New File in the Annotation window.


View with Public Data
- To quickly get an idea of basin dimensions, outlines, strat columns, and established plays, go to the Display tab and select all the public data available to you in PetroDE. This includes layers such as US Sedimentary Basins, National Oil and Gas Assessment 1995 study, Federal and Indian Lands, EIA contours, etc. The example here shows Sedimentary Basins.

Search Subscription Data Layers
- Go to the Search tab and enter IHS Wells and IHS Production into the layers to search. Select All Time in the Time Period Selection box to see all the data available.
- Next go to Advanced Search and select Formation as the column to search. For the Search Term, enter the formations in the acquisition area. In the example below, we searched for the Mancos and Gallup Formations. The result appeared in 6 seconds.

Integrate Proprietary Information
- Display any proprietary data layers your company has on the acquisition area plus data for similar analog areas. In this example, we can instantly view EIA data of the Delaware Basin and Bone Spring play (public data) together with proprietary data that includes tops, test data, calculated EURs and contours of heat flows.

Quantify Risk and Reward
- To get a feel for the number of wells and their production streams in the area of interest or a similar analog area, select the area on the map using the AOI tools under Search.
- Go to the Analysis Panel and select IHS Production as the layer to analyze. Select Charts -> Time Series and click Monthly Production. This chart was generated in 19 seconds. The time required to generate the chart depends on the number of wells in your area of interest. Questions to ask about the Monthly Production chart: Does the monthly chart show a consistent number of wells for a year or two? Is the average curve at all smooth?
- To instantly calculate decline projection curves for any area of interest, click on the Decline Projections option under Time Series charts. The projection lines are calculated using the Arps or SE equation and are fitted using quantile regression to get the best fit curves. Q0 is the initial rate, b is the hyperbolic exponent that controls the shape of the curve, and D is the decline. Q0 is in mcf/day. The red P10 curve shows the value where 10 percent of the outcomes (or values) are greater than this value. The green P90 curve shows the value where 90 percent of the outcomes are greater than this value.
- To view the 30-year EUR projection, click on Cumulative Projections, then in the Production field, select Combined Mean. Click the Display button. This chart was generated in 16 seconds and shows the calculated mean line for Liquid, Gas, and Water plus an estimated 30-year EUR for each.


7.9 Using Custom Heat Map Grids to Analyze Performance
PetroDE's heat maps allow users to customize the grid with any polygon shapefile layer that they have access to in their workbook(s). In this workflow example, we show you how to utilize this feature with a Lease Data layer, as well as a Basin layer.
Compare Average IP Oil for your Leases
- Ensure your leasehold layer has been uploaded to PetroDE and is listed under the Display tab as a searchable data layer (
. To upload a shapefile, go to the Create tab and select Create Layer and follow the instructions in the Create Layer Wizard (for a video tutorial, click here.
- 2. Search the IHS Wells data layer for the area of interest. In this example, we will search an area of interest in West Texas. Go to the Search tab and type IHS Wells in the top filter box. Then click on the rectangle Area of Interest tool and draw a rectangle around the area of interest. For the Time Period, select All Time. Click the Search icon.
- Next, scroll down to the Analysis card and select Map Display -> Heat Maps -> IP. Click on the drop-down menu for Grid and select your lease layer as the grid. For the Parameter, select Oil. Once loaded, you can see which leases have the best IP Oil (pink squares).


Analyze Well Performance by Basin
Follow the steps below for an easy way to analyze well activity by Basin.
- Select the IHS Wells Layer in the search layer box and select All Time for the time period. Click the Search icon.
- Scroll down to the Analysis card and select Map Display -> Heat Maps -> IP. Click on the drop-down menu for Grid and select US Sedimentary Basins as the grid. For the Parameter, select Boevd21. The resulting map allows you to see which basins have the best performing wells. To see a different time period, scroll up to the time period selection box and select a different time period. A new map will begin loading automatically.

7.10 Using Change Detection to Find Changes in Well Status
This workflow can be used to find changes in any column of your choosing.
- Search the IHS Wells data layer for a specific entity or draw an area of interest using the Area of Interest tools. In this example, we will draw an area of interest in the Permian Basin. Go to the Search tab and under Area of Interest, select the rectangle tool. Click and drag the rectangle around the desired area. For the time period, select Past Year. Click the Search button.
- Scroll down to the Analysis panel and select Change Detection -> Custom. Select the drop-down for Choose Columns and select Well Status to see only data changes in Well Status. Select Last Update under Show Changes Since. Click the Display button.
- To show only the wells that changed to spudded since the last update, open the Refine card and select Well Status. Once loaded, select spud. This shows only wells where the status changed to spud since the last update.
- Click on a text balloon for any well and then click on Changes to see the details of the change. In this example, we see that this well was previously permitted and has spudded since the last update.
- To check for wells where the status changed to producing, go to the Refine card and select prod instead of spud.
- To show new permits, go to the Custom section of Change Detection and toggle Show Added Rows to the on position.
- Then, on the Refine card, select permit under Well Status.


Appendix I. Glossary of Terms
- /ft: Per feet of perforations; from Upper Perf to Lower Perf
- 3mCumxxx - 60mCumxxx: 3, 6, ... 60 month cumulative production calculated by PetroDE for the first month, first 6 months, ... first sixty months of production.
- ABHL: Absolute Bottom Hole Location
- Activity Code: Code indicating activity status.
- A = Permit
- B = Active (Spud, no completion date)
- C = Completed, more info expected
- D = Completion
- E = Abandoned Location
- API: American Petroleum Institute Identifier
- Arps: Uses the Arps equation to calculate decline curves
- Basin: Name of geological basin
- BH Latitude: Latitude of bottom hole location
- BH Longitude: Longitude of bottom hole location
- Capex: Capital expenditure per foot of well drilled
- Comp Date: Well completion date
- County: County or Parish where well is located
- Current Production Status: Last known production status of a wellbore (Active or Inactive)
- Default Date: Date column used in the date range selection menu in Super Search or the Default Date option in Advanced Search:
- IHS Wells Default Date Column: Most recent date from either Completion Date, Spud Date, or Permit Date.
- IHS Production Default Date Column: First Prod Date
- User Uploaded Layer Default Date Column: Specified in the Create Layer Wizard upon upload for layers containing date clumns. If the default date is set to none, no date range selection menu appears in Super Search and no Default Date column option appears in Advanced Search.
- Driller TD: Driller total depth
- Drill Time: Number of days between Spud Date and Final Drill Date
- Field: Name given to field
- Field Code: IHS assigned code for the field name
- Final Drill Date: Date the drilling operations for the well were finalized
- Final Status: Current status of the well. US wells use the final status (oil,gas,dry hole,etc)
- Final Status Code: Code identifying the final status or intent of the well. 1 = Oil, 2 = Gas
- Formation: Formation Name; can be from IHS data columns Proj Form, IP Prod Form Name, or Form at TD
- Form at TD: Formation at total depth
- GOR: Gas to Oil Ratio; cf / bbl
- HCMIX6: Formula: oil / (oil + gas/6) * 100. Yields fraction of HC that is oil with gas to oil conversion of 6. Bounded 0-100
- HCMIX21: Formula: oil (oil + gas/21) * 100. Yields fraction of HC that is oil with gas to oil conversion of 21. Bounded 0 - 100
- Hole Direction: Direction in which a well is drilled; can be horizontal, vertical, or directional
- IP: Initial Potential
- IP Base Formation Code: Code identifying the formation at the base of the perforated interval
- IP Base Formation Name: Name of formation tested
- IP Boe6: Initial Production Barrels of Oil Equivalent with ratio of 6
- IP Boevd21: Initial Production Barrels of Oil Equivalent by value per day with a ratio of 21 (which is like gas selling for $2.50/mcf and oil for $52.50/bbl).
- IP Choke Size: A description of the choke size (e.g., 1-1/4 inches)
- IP Condensate: Amount of condensate flowed during the test
- IP Condensate Gravity (API): Value for the condensate API gravity; derived by dividing the specific gravity of fluid at 60F into 141.5 and then subtracting 131.5
- IP Condensate Ratio (BPMCR): 141.5 and then subtracting 131.5
- IP Gas: Amount of gas that flowed during the production test; Mcf/D
- IP Liquid: Amount of total liquid that flowed during the production test
- IP Mulitforms: Name of formation tested
- IP Oil: Amount of oil that flowed during the production test; barrels / day
- IP Oil Gravity (API): API oil gravity. Computed by dividing the specific gravity of a fluid at 60F into 141.5 and subtracting 131.5
- IP Perforation Lower Height: Measured depth from the surface to the base of the test interval
- IP Perforation Upper Height: Measured depth from the surface to the top of the test interval
- IP Production Formation Code: Code identifying the formation at the top of the perforated interval
- IP Production Formation Name: Initial Potential Production Formation
- IP Water: Amount of water that flowed during the production test; barrels / day
- IRR: Internal Rate of Return
- Last Activity Date: Date any portion of the well was updated within PI/Ds corporate repository
- Lateral Length of Horizontal Displacement: Horizontal/map distance measuring the displacement of the point above the terminus of a lateral hole from the surface hole location
- LGR: Liquids to Gas Ratio; bbl / (mcf/1000)
- Lease: Lease Name
- Liquid: Oil + Condensate
- Map Symbol: Primary product code used to determine the map symbology. Click here for the list of codes.
- Oldest Age Penetrated Code: Three digit code for oldest geological age penetrated
- Oldest Age Penetrated Name: Name of oldest geological age penetrated
- P10: the value where 10 percent of the outcomes (or values) are greater than this value.
- P50: the median of a distribution, such that 50 percent of the outcomes are greater, and 50 percent of the outcomes are less than this value.
- P90: the value where 90 percent of the outcomes are greater than this value.
- P10/P90 ratio: uncertainty range of the distribution of values. A smaller ratio indicates the values have lower variance. A larger ratio indicates a greater spread in the data.
- Peak Production (Peak 30): Production in peak month. Peak month is found by using average daily BOE6 to compare the total production stream. It requires 2 or more months of available data and is calculated by dividing by number of days on if available, or 30 if not available. If the maximum month is the first month of production and days on is not available, the average daily rate is divided by 15 for that month.
- Peak 60: Average production day rate over two months starting in the peak month as defined by Peak 30. Days on are used when available.
- Peak 90: Average production day rate over three months starting in the peak month as defined in Peak 30. Days on are used when available.
- Percent Determined: Percentage of count needed for 90% confidence. The calculation is based on the P10/P90 ratio. A large P10/P90 means the data has a lot of variability, so more data is needed to have a certain level of confidence in the result. PetroDE's calculation of percent determined is based on the recommended minimum sample size for each P10/P90 ratio found in SPEE Monograph 3, Guidelines for the Practical Evaluation of Undeveloped Reserves in Resource Plays, 2010, Society of Petroleum Engineers.
- Perforation Length: Difference between uppermost and lowermost perforation on the property
- Permit Date: Date well permitted
- PetroDE Insert Date: Date entry was inserted into the database
- PetroDE Update Date: Date entry was last updated in database
- Play: Name assigned to the hydrocarbon play
- Play Type: Code identifying the type of play
- SE: Uses the stretched exponential method to calculate decline curves
- Spud Date: Date drilling started
- Target: A code used to indicate the target objective for the well; for example, oil, gas, etc.
- TD: Total Depth
- trt Acid: Amount of acid used in treatment of well
- trt Frac Stages: Number of records on well where the treatment type = FRAC
- trt Num Records: Total number of treatment records on a well
- trt Total Fluid: Value for the amount of treatment fluid used in treating the interval
- trt Total Prpnt: Amount of proppant agent used in the treatment fluid. Propping agents are used to hold the fractures open after pumping stops
- TVD: Total Vertical Depth
- WACC: Weighted average cost of capital
- Water Cut: Mass percentage of water in all liquids; Water/(Water + Liquid)
- Well Num: Well number
- WOR: Water to Oil Ratio; bbl/bbl
Appendix II. Updating Petra® Projects
PetroDE® makes it easy to quickly update your Petra® projects. Use this workflow to:
- Refresh your Petra project with new wells in your IHS data
- Refresh your Petra project with new wells in your rig drilling data
- View changes between updates
Use the AOI tools to create the same boundary as your Petra Project
- In the Search tab, select either IHS Wells or RigData Drilling (or both) as your layer(s) to search.
- Using the Area of Interest tools, add your project to PetroDE by drawing an AOI that is the same as the boundary of your Petra project. It can be a rectangle, circle, or polygon.
- Click the search icon to load the IHS wells.

Use Change Detection to view wells added since last update
- Next, select the desired data set in the Results card if you searched more than one.
- Scroll down to the Analysis Card and select Change Detection.
- Updates for IHS data occur once a week. Updates for RigData occur every day. Depending on when you last updated your Petra project, select Added in Last Update or Custom. If selecting Custom, turn on Show Added Rows, Under Choose Column, tick Select All or select your desired columns. Select the desired update date. In the example below, we choose a date range of 2 weeks.
- Click the Display button. Note that the number of results are not updated until the Display button is clicked. All the newly added wells are displayed on the map.

Download search as CSV
- Select Download Search from the top right corner of the Analysis card.
- Choose Download layer as CSV.

Import new wells into Petra
- Open the CSV file and go to the API column.
- Format the API column to be 14 digits instead of scientific notation.
- Save this column as a text file.
- Remove any APIs that are not valid, such as those with the year as a placeholder.
- Import the API text file into Petra. Note that by importing only the APIs, you are not required to define any additional columns, and Petra can't overwrite the existing wells.
- In Petra, run a query of wells added or with any change on today's date. This will be all the new wells and any of the wells with a change (such as status).
- For IHS wells, send this list to Enerdeq via Direct Connect. Petra will create a new well for each new API/UWI on the list.
